Africa Progress Panel: Lights, Power, Action - Electrifying Africa
CASE STUDY
Project Goals and Challenges
The 2017 report serves as both an educational and political tool for governments, partners and the wider public.
This is a policy paper, and its aim has been to highlight the need to move faster to bridge the continent’s huge energy gap by adopting every available solution, both on and off the grid.
Telling the story using a series of infographics interspersed between the text report was both exciting and challenging as LD worked as an annual report designer with the various teams involved in the project to bring their important messages to life in a visually exciting yet easy to understand format.
Showing a ‘before and after’ scenario was one way we as an annual report design agency told these stories, as shown on the sustainability argument on page 12 and 13 of the report.
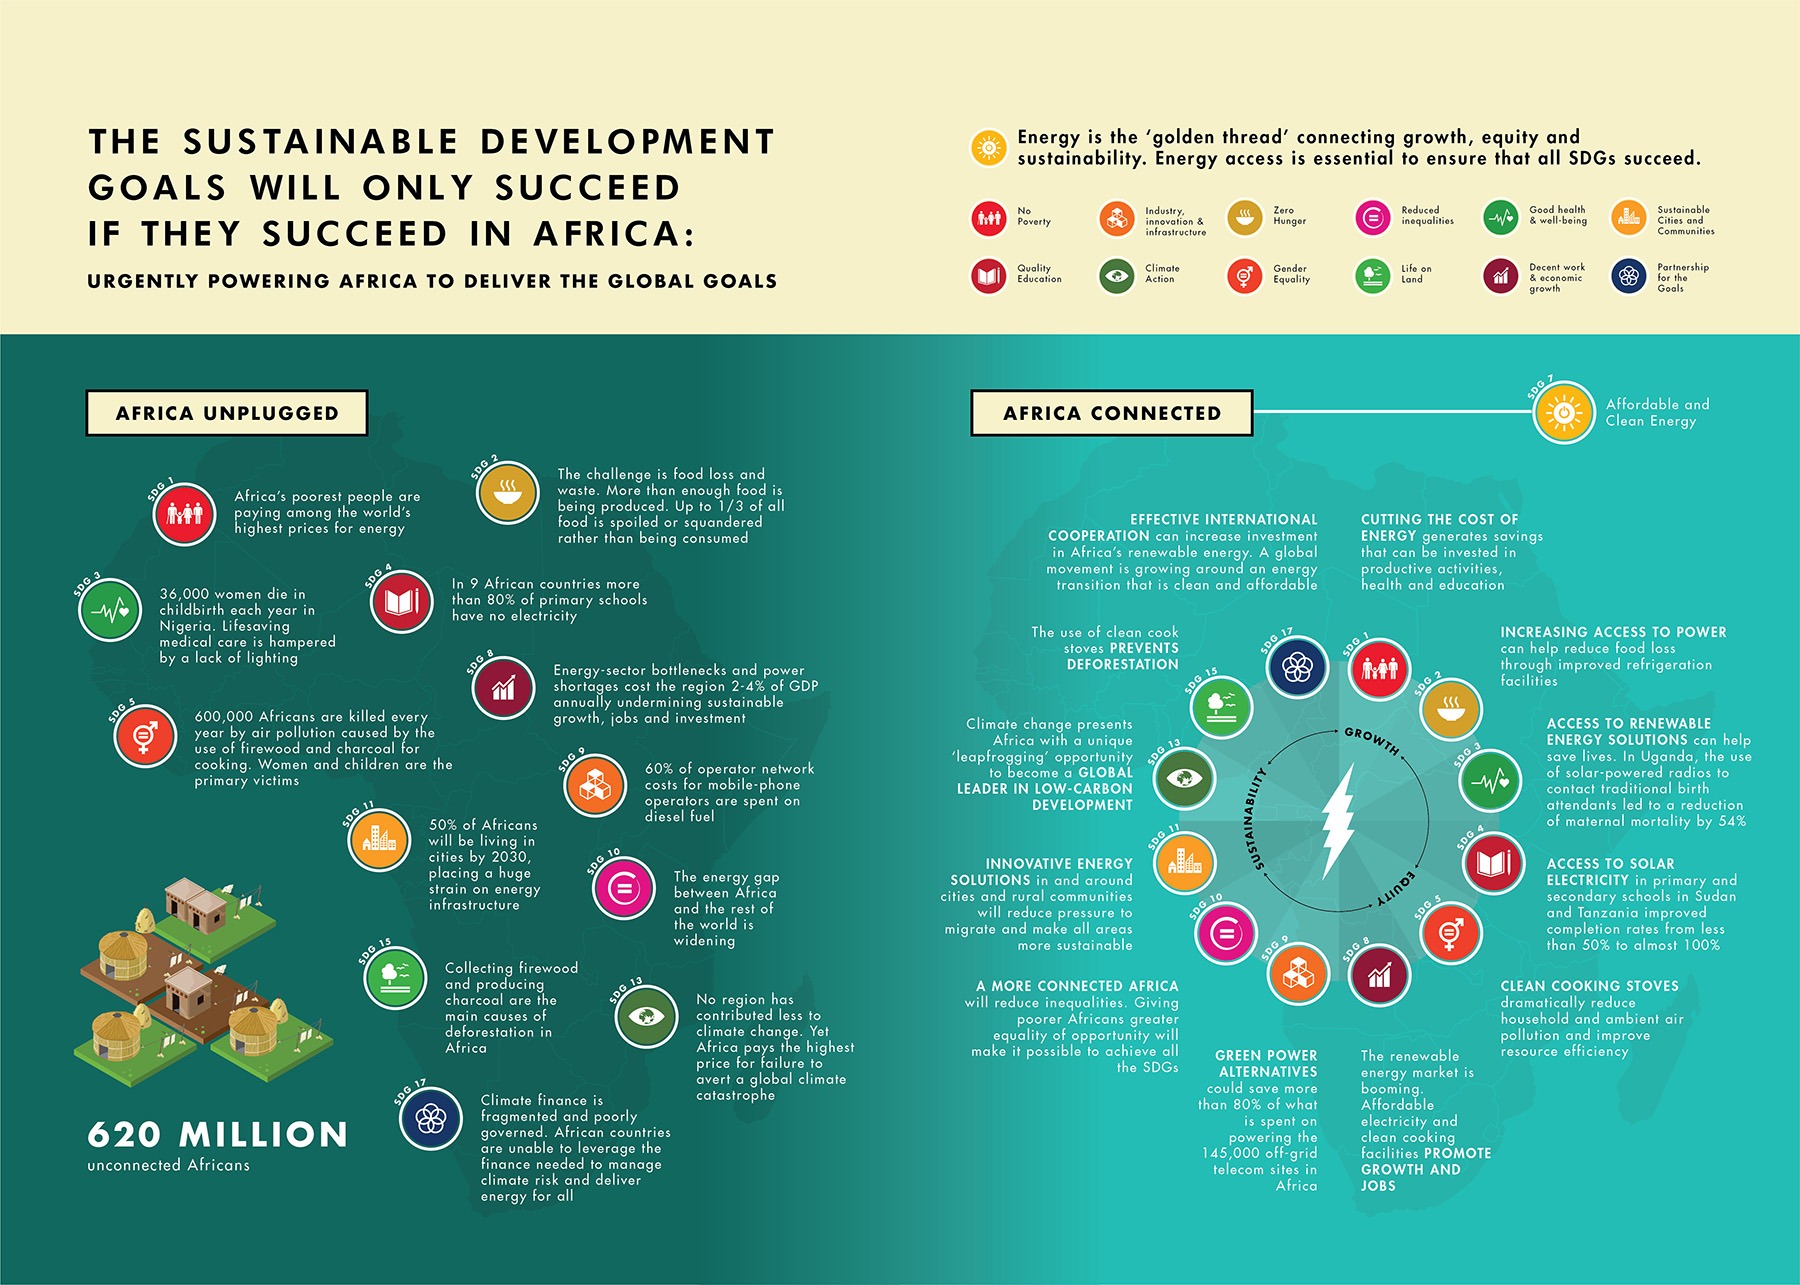
Here we compared Africa Unplugged with Africa connected – from the very simplistic dark versus light rendering to the display of data that went from somewhat disjointed to clean, clear and connected on the following page. Sustainability was a huge part of the report messaging, and ensuring affordable clean energy was visually highlighted in the design.
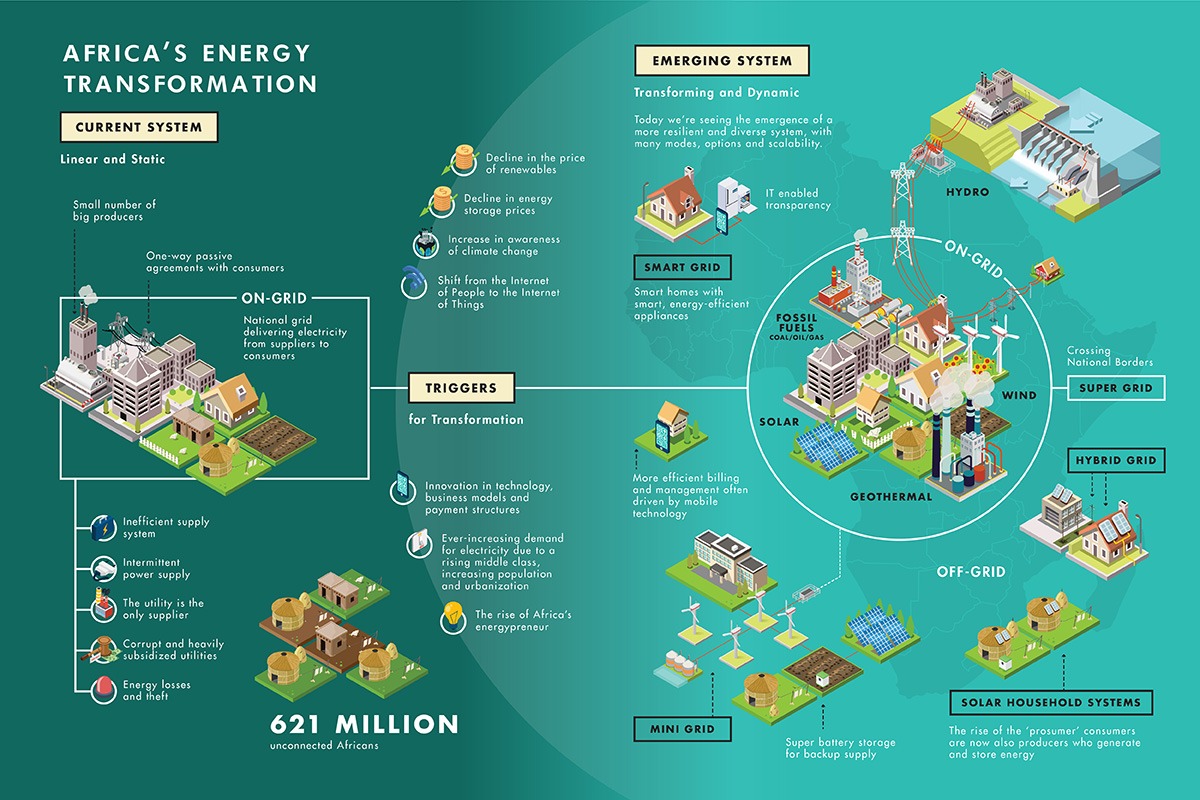
Page 18 and 19 of the report was one of the biggest challenges – as we worked through multiple iterations of this 2 page spread to highlight the potential energy transformation that Africa could achieve in the future.
Late To The Project
As we were coming in later into the project, we were working with a design that had already been done but wasn’t working.
We also worked the copy content back and forth to find the best breakdown of the language that would allow us to present the story as visually as possible. This is a crucial element for any annual report design agency. Most importantly so the visuals told the story together with the story rather than stumbling over each other or telling opposite messages if either were to be removed from the graphic as a whole.
This has always been an important part of data visualization – the strength of the messaging told by the visuals that are complementary to the text, not just unnecessary icons.
The end result was a 2-page piece that worked both within the story of the report and also as a standalone graphic that could be used in isolation to convey the message as a shareable visual online, as is our strongest piece of the report.
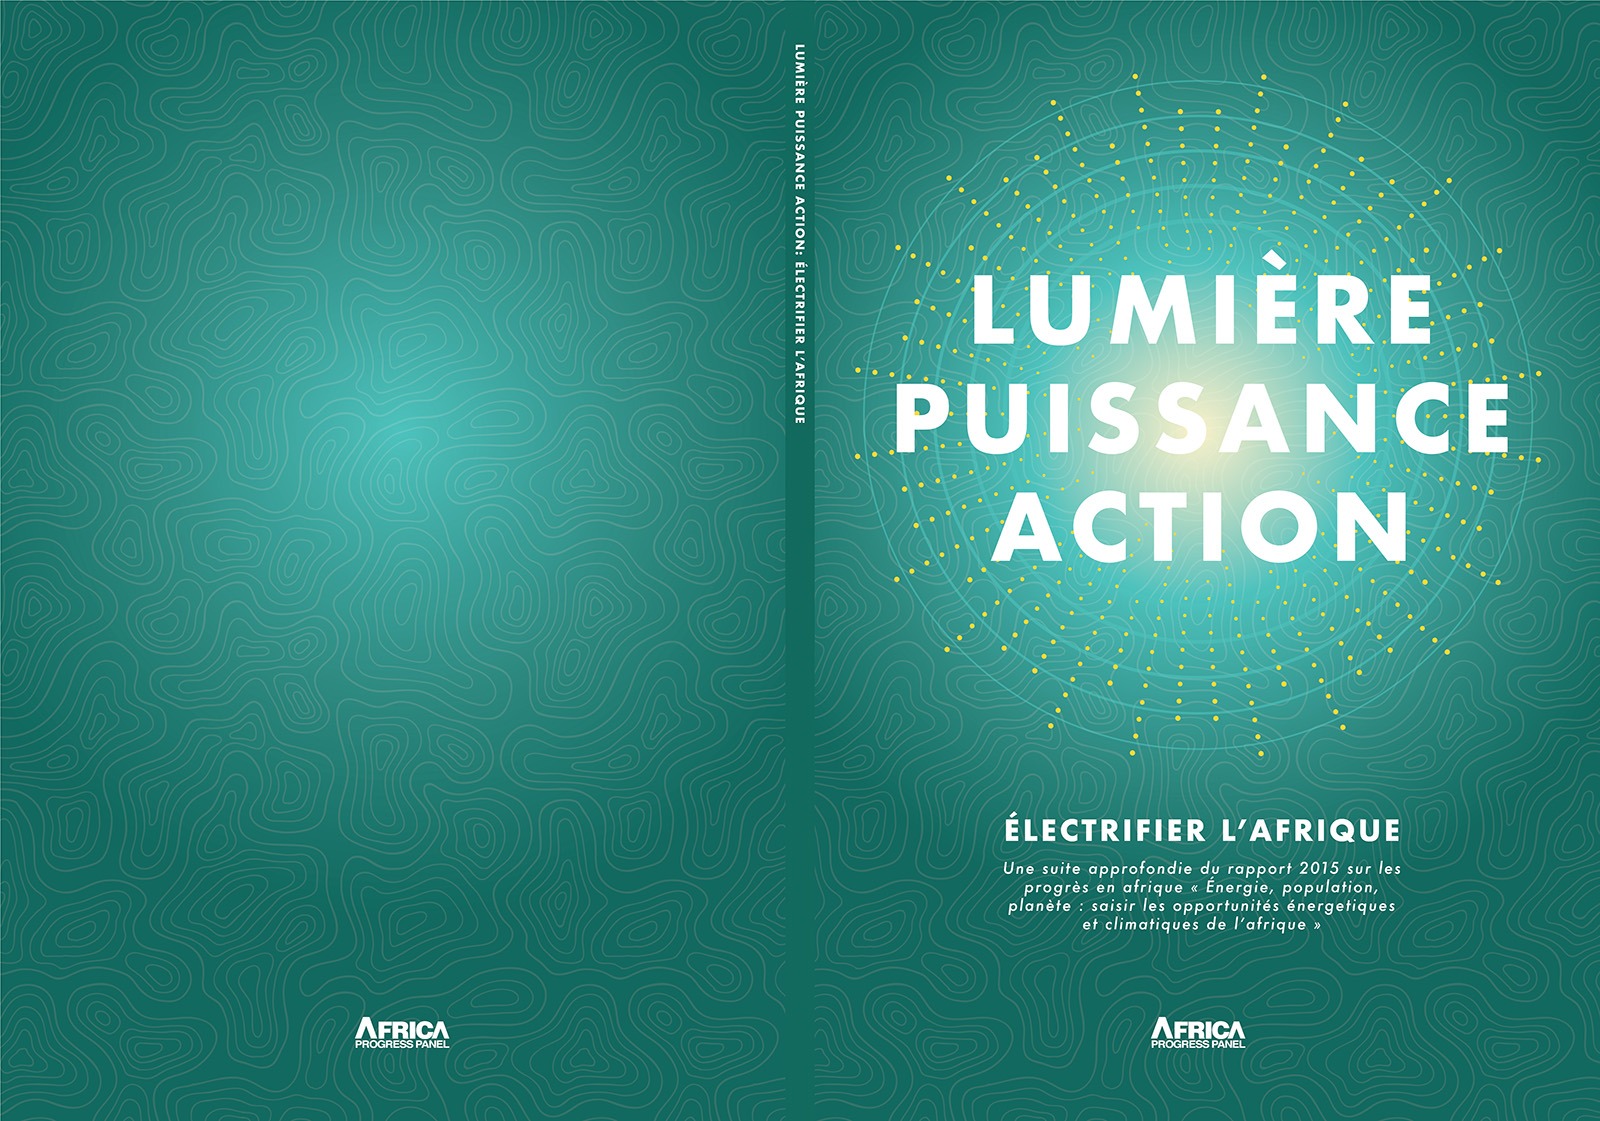
Delivering the approved graphics and covers in both English and French for print and online delivery was the final step of this project – coming in on time and on budget as we worked with this client under NPO rates.
The Final Word
Back Yourself With An Expert Full-Service Marketing Team
AGENCY HIRE
AGENCY HIRE
Great Choice!
CONSULTANT
CONSULTANT
Great Choice!
If You're Ready to Party, We'll Bring All The Snacks.
We’re available 24 hrs a day and we are more responsive than a Formula 1 car. Get in touch to start your project today!
