Transport for London
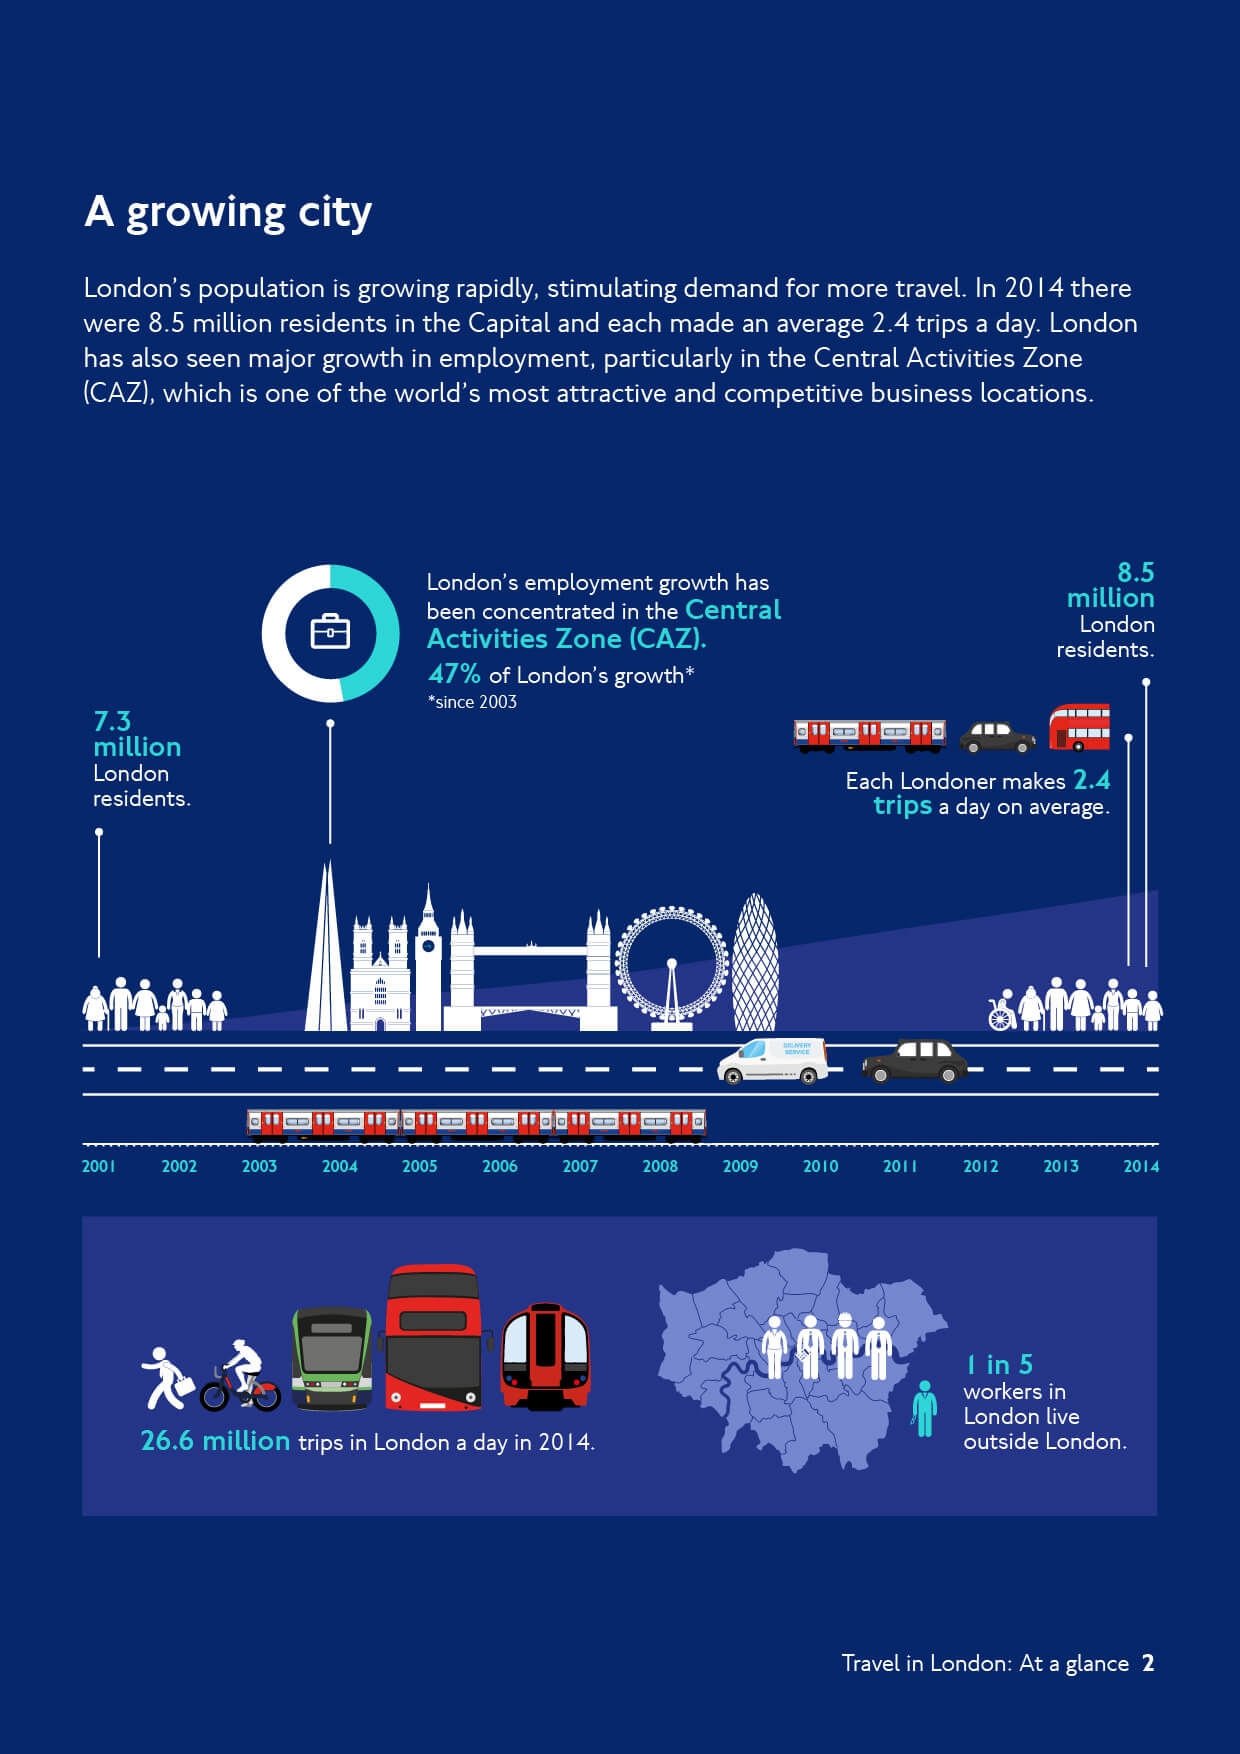
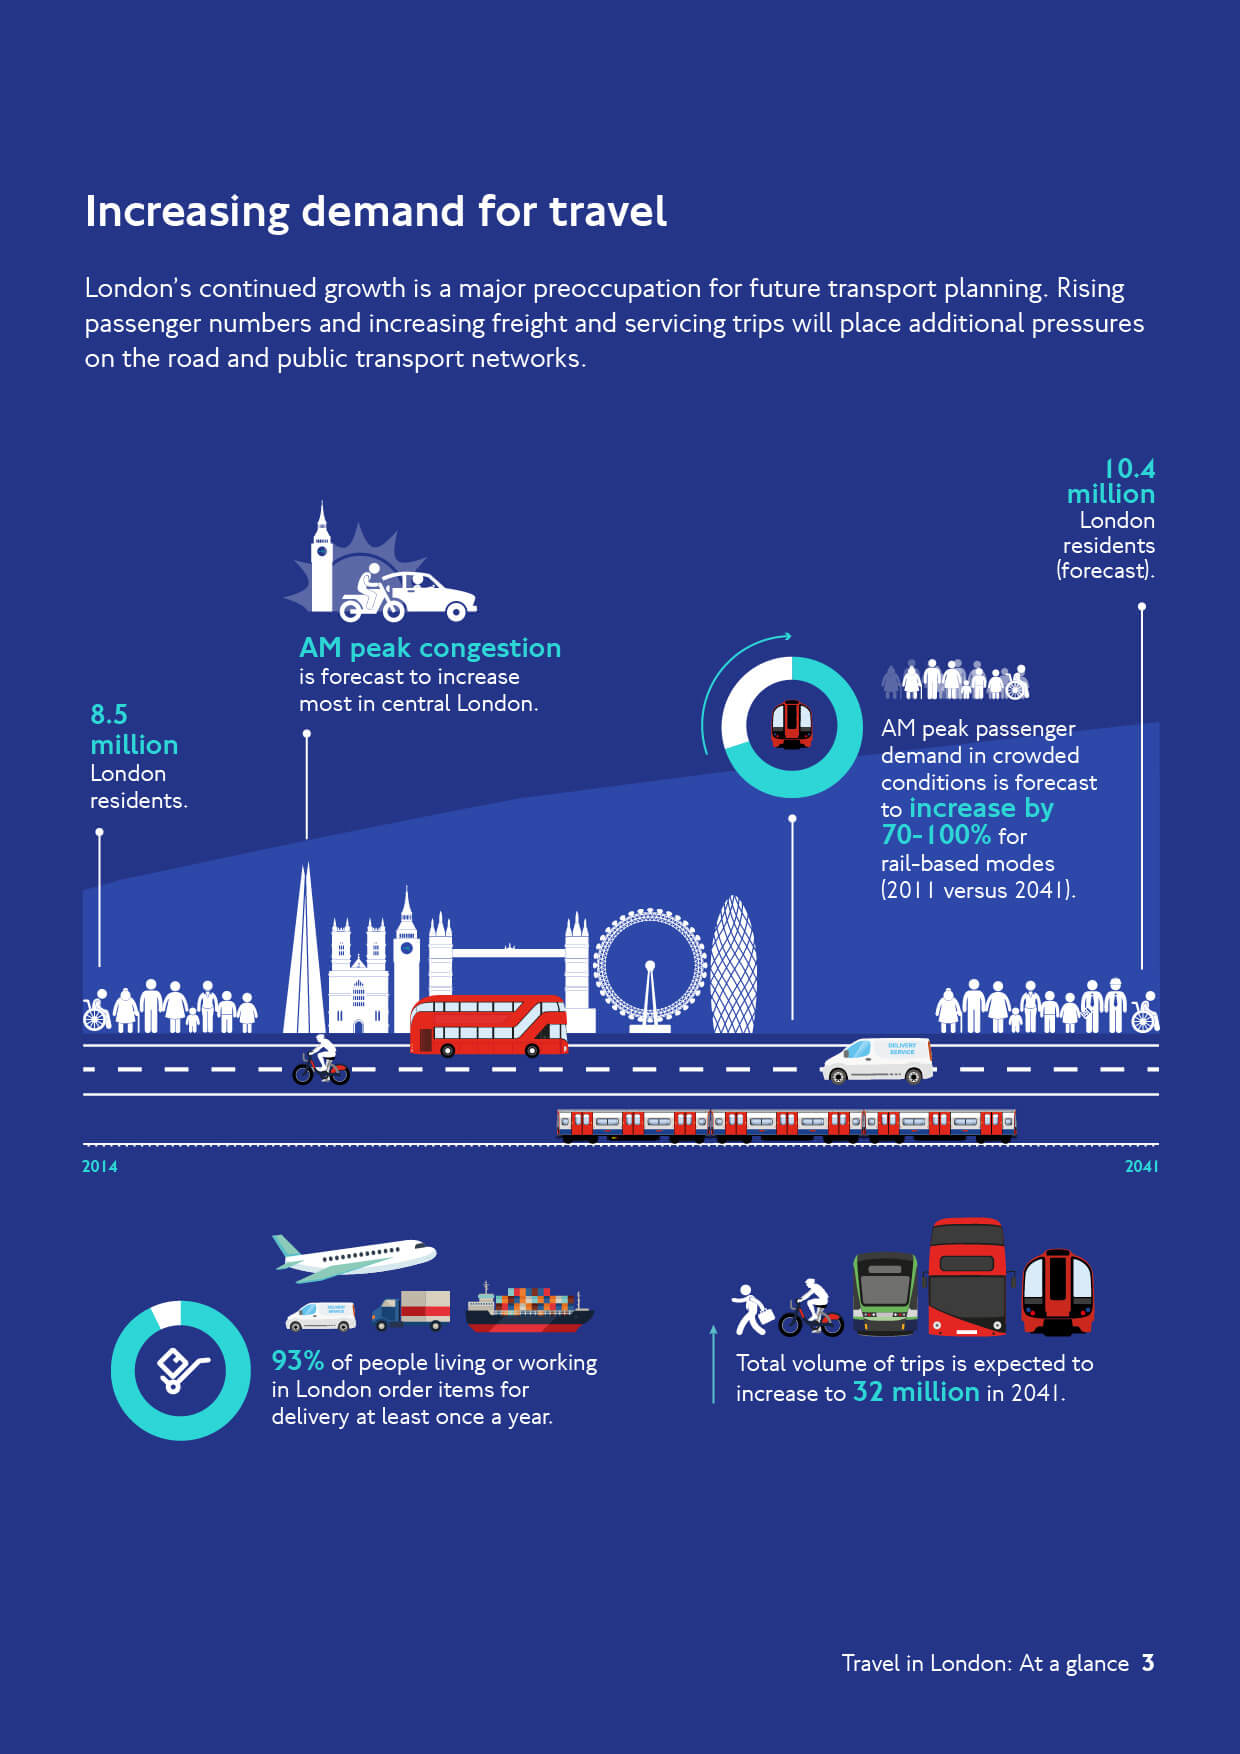
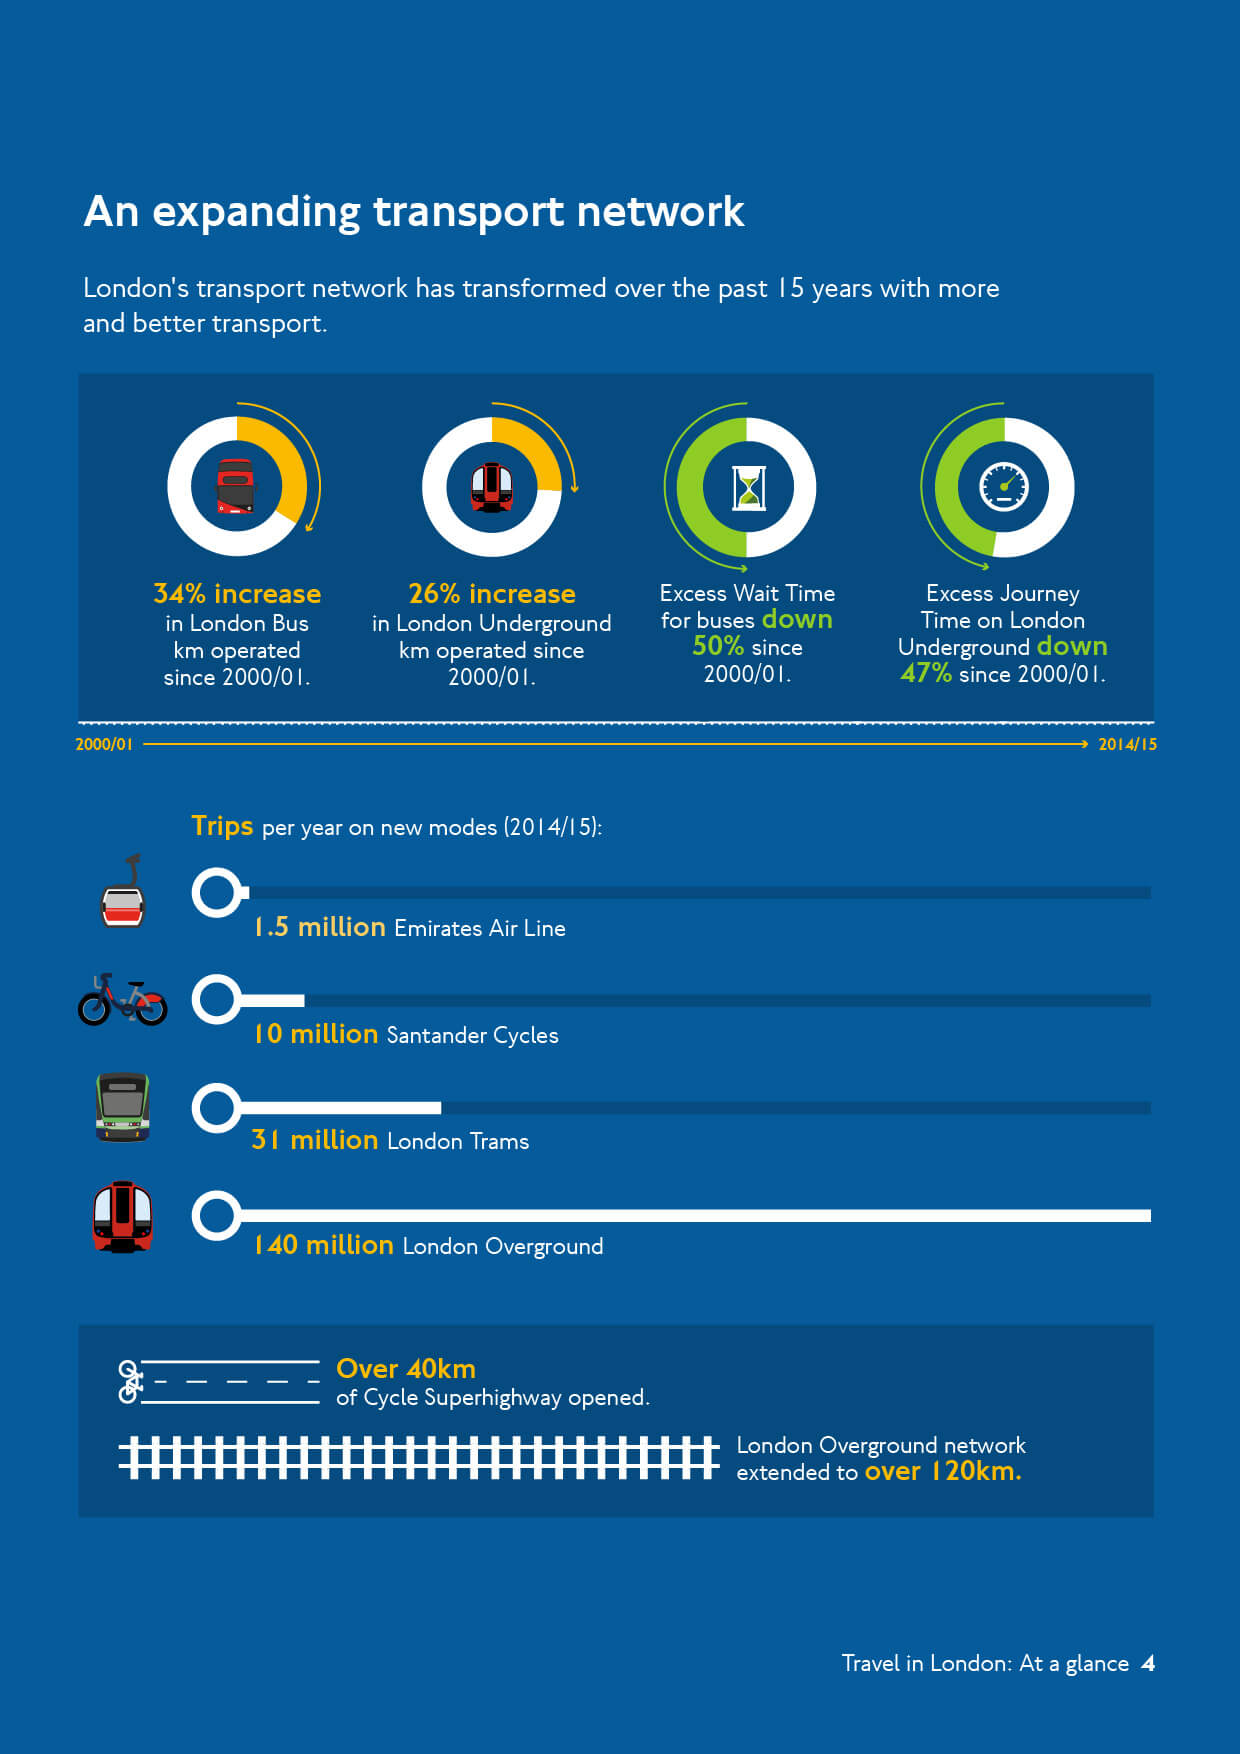
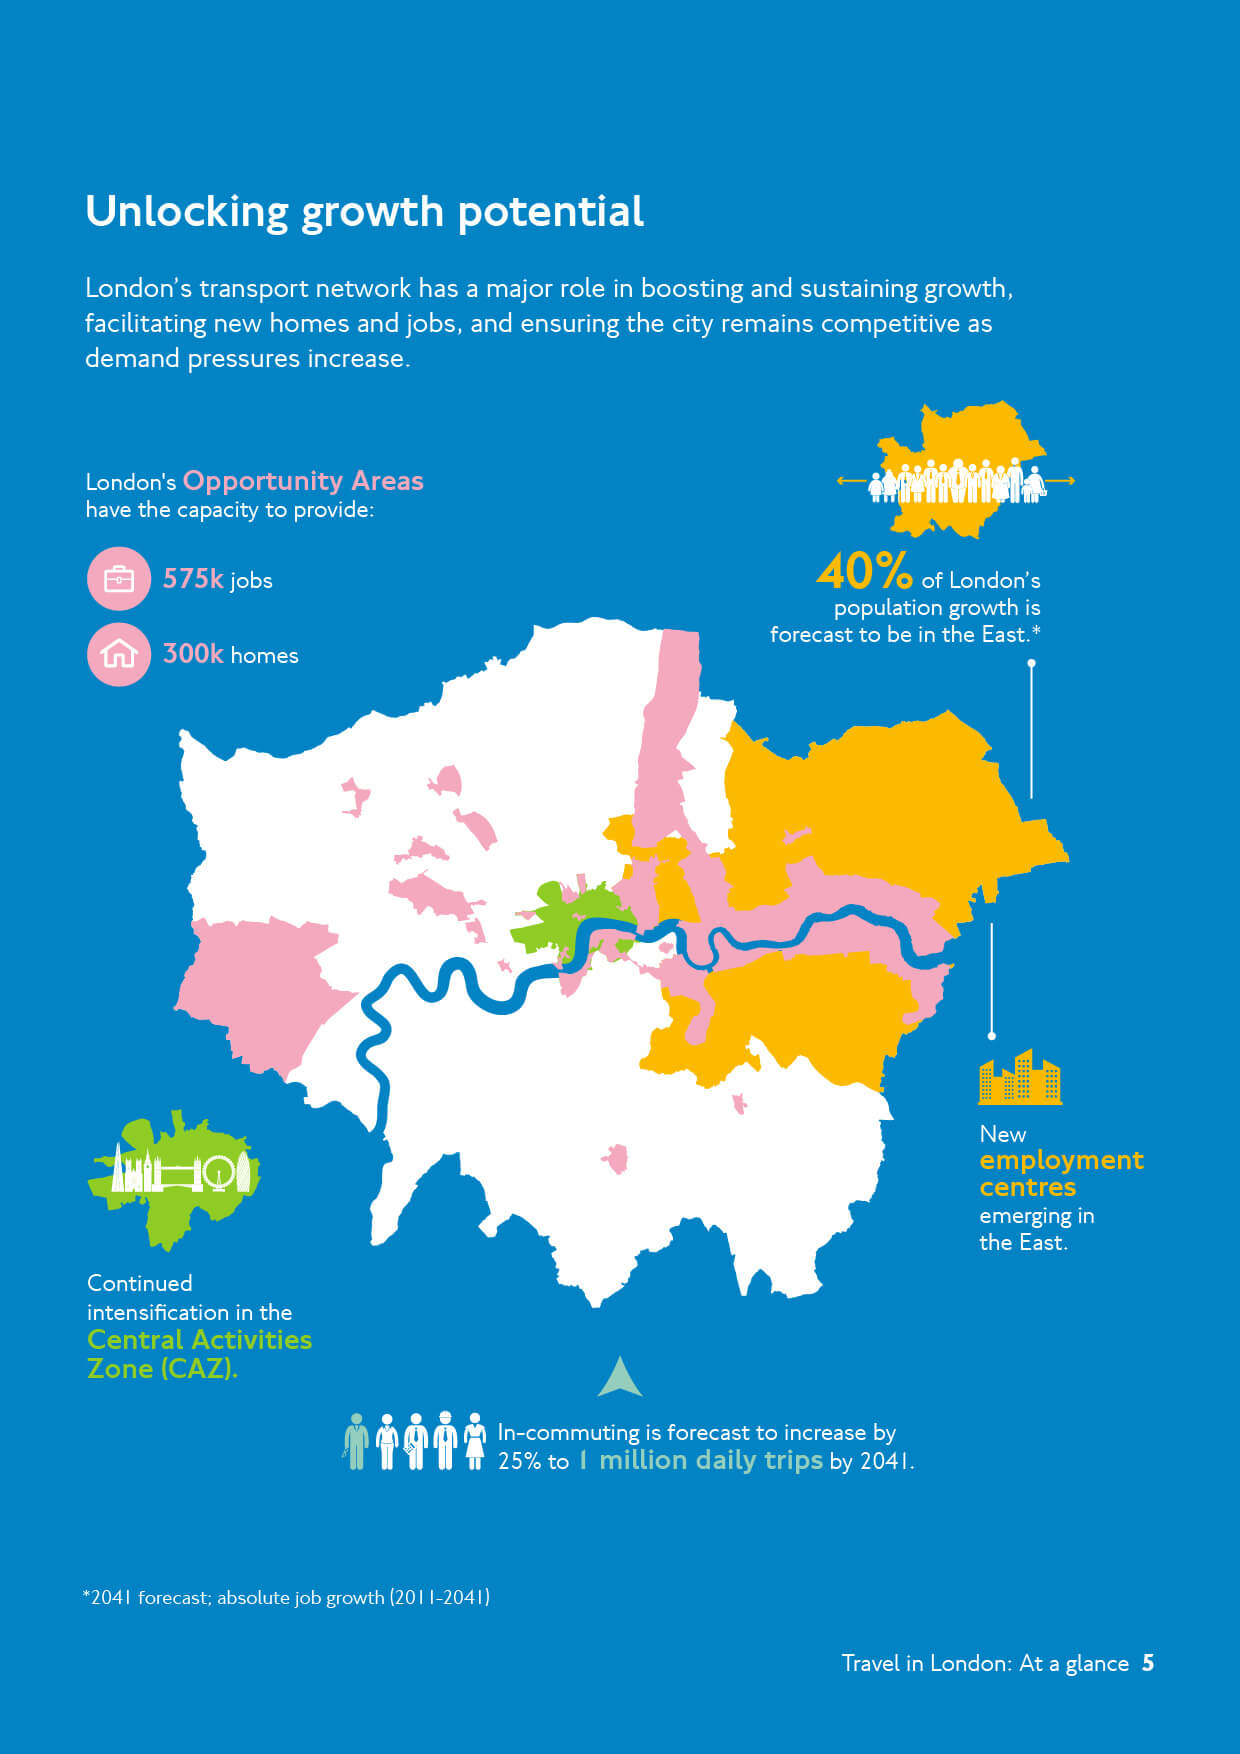
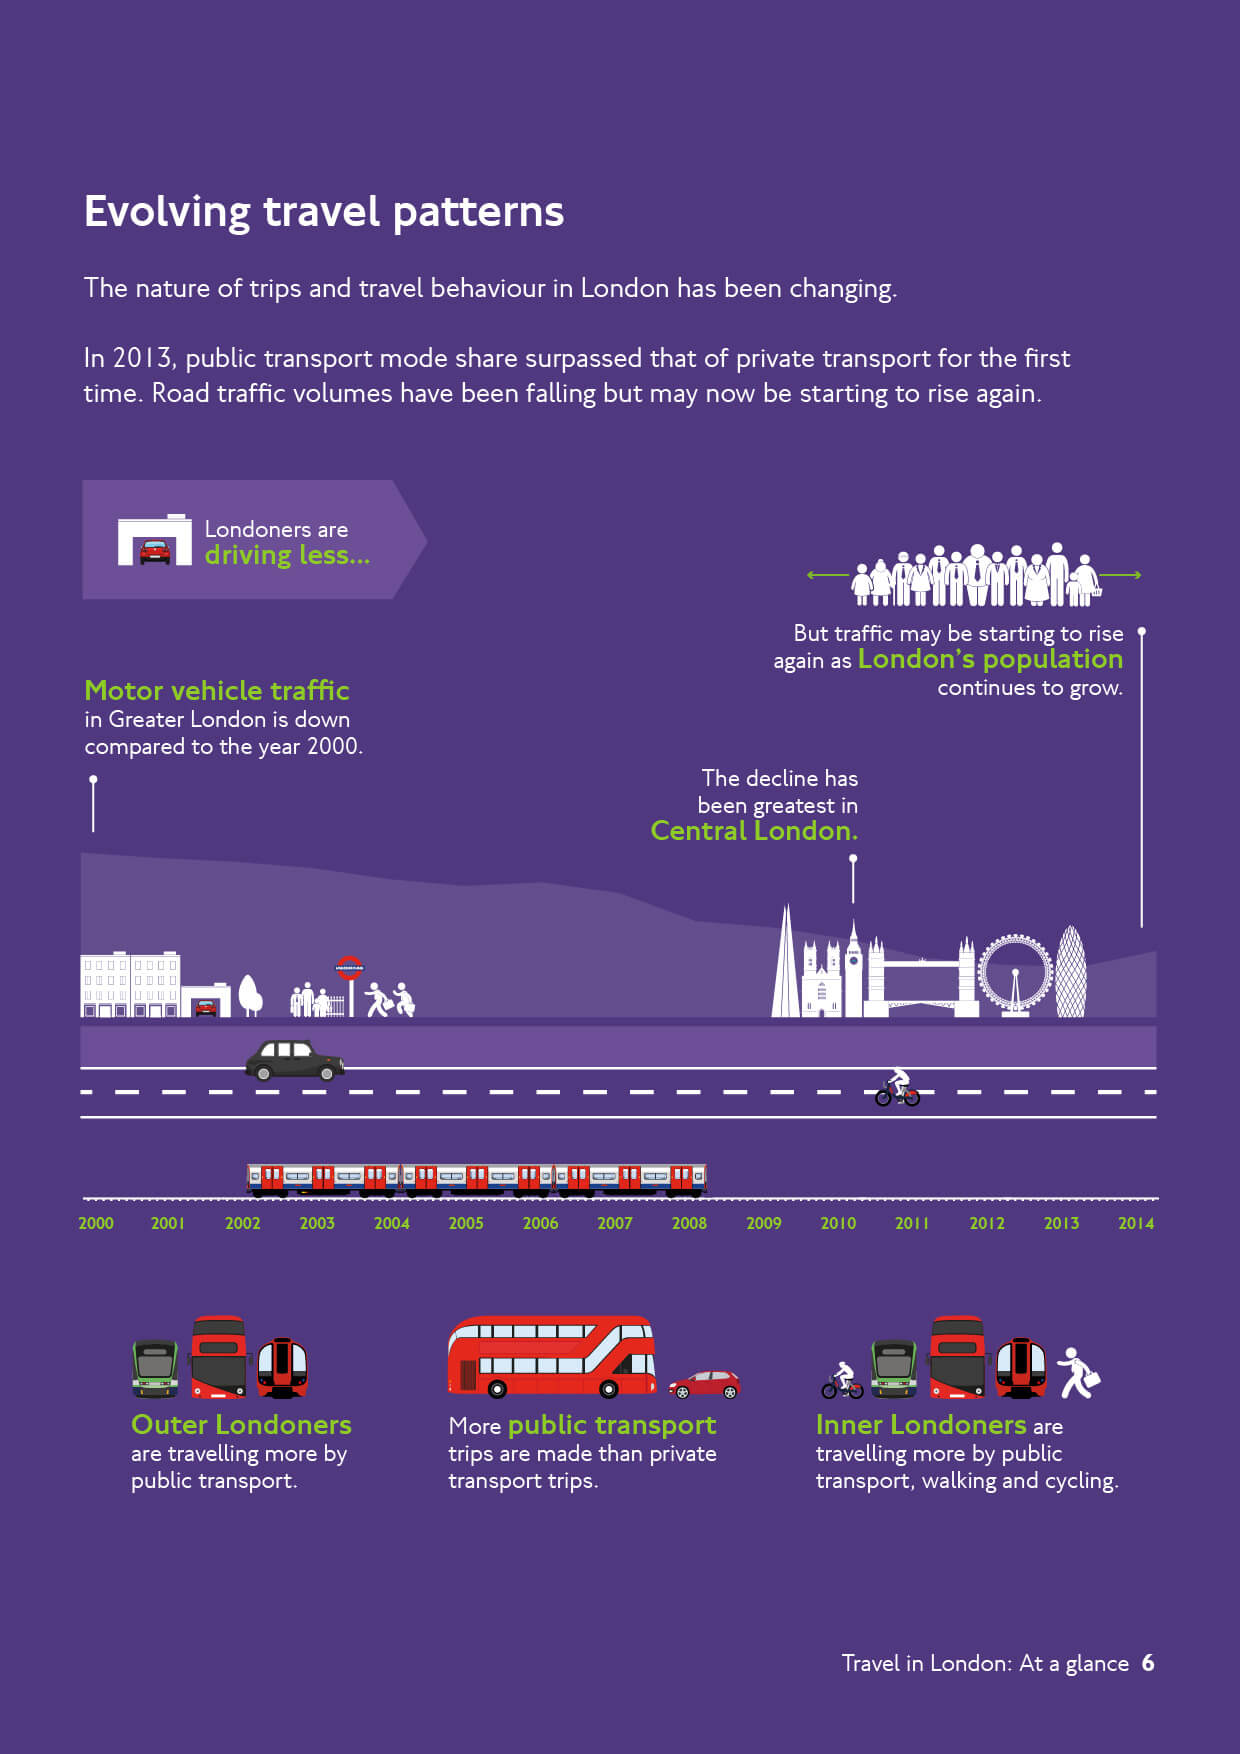
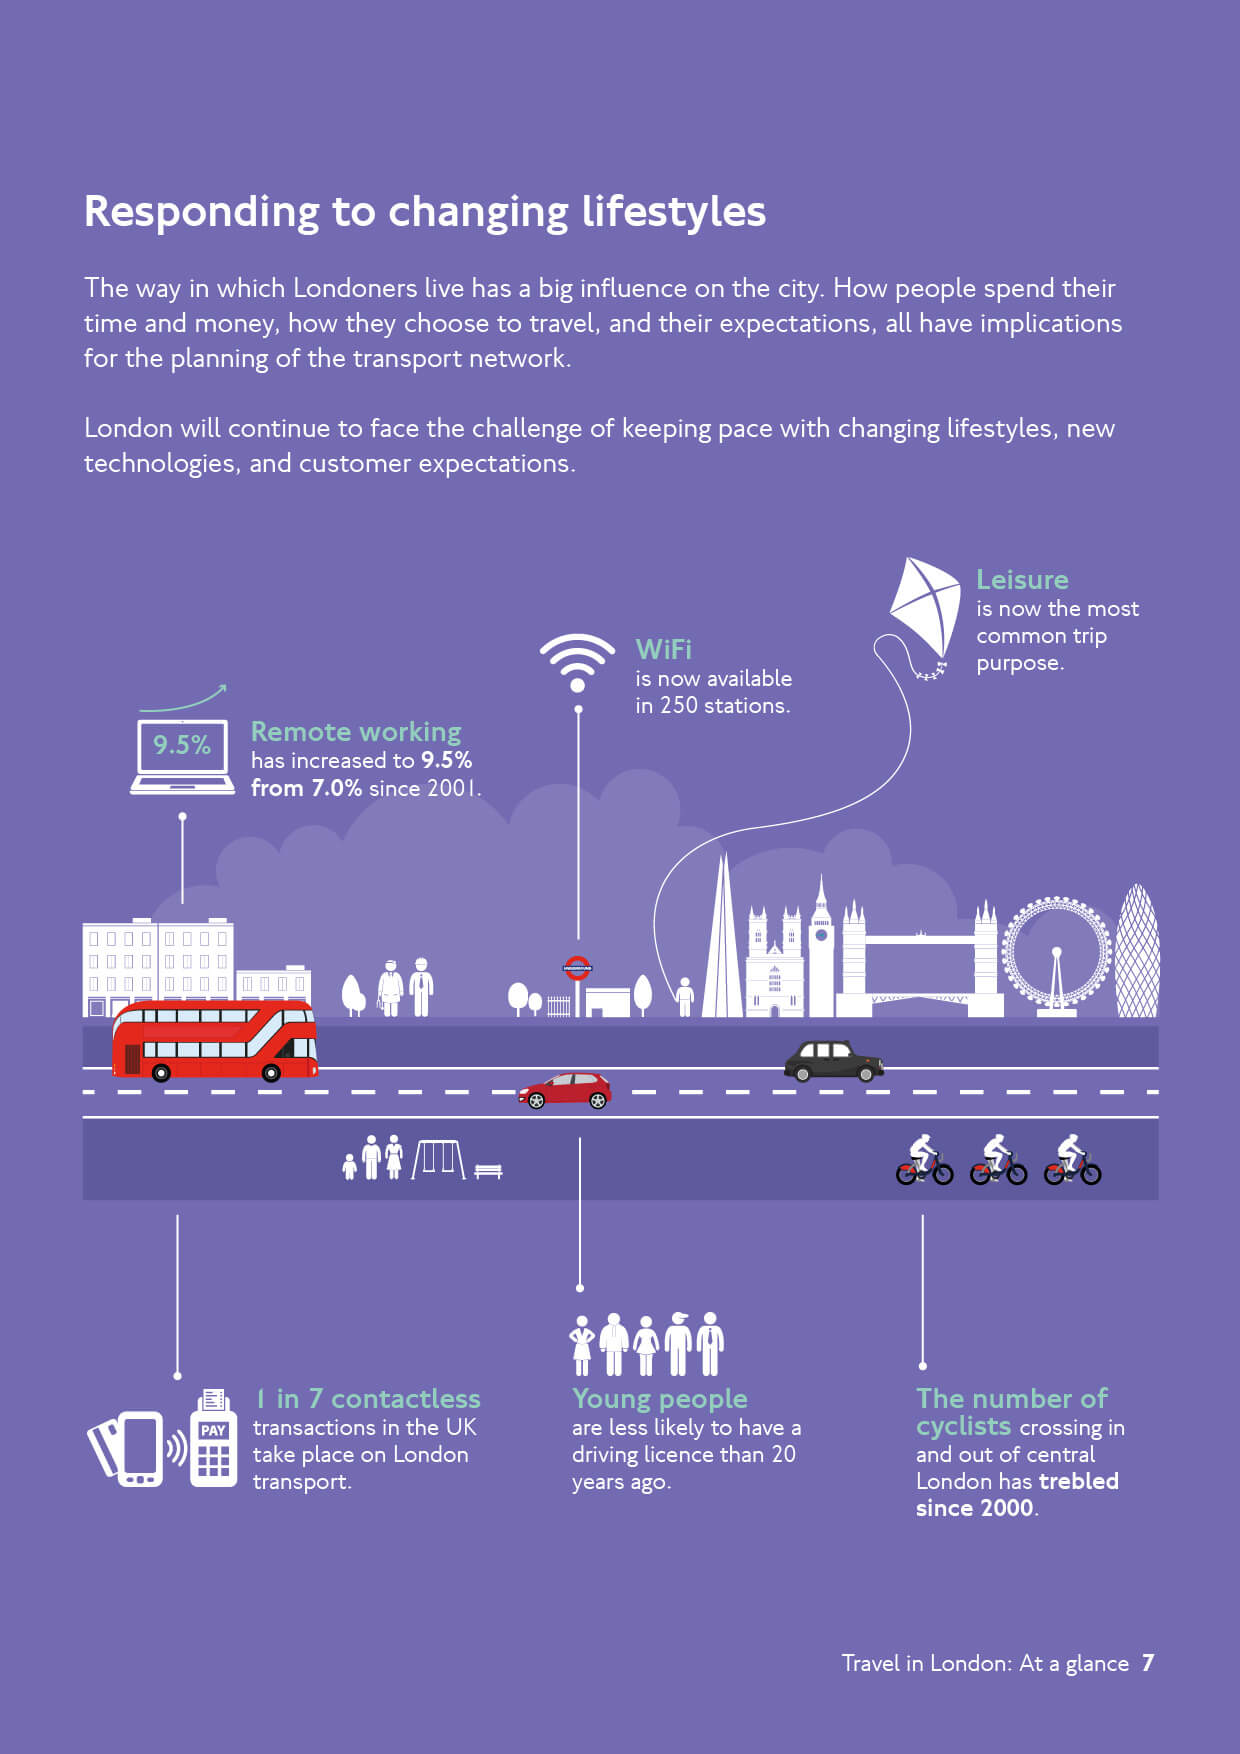
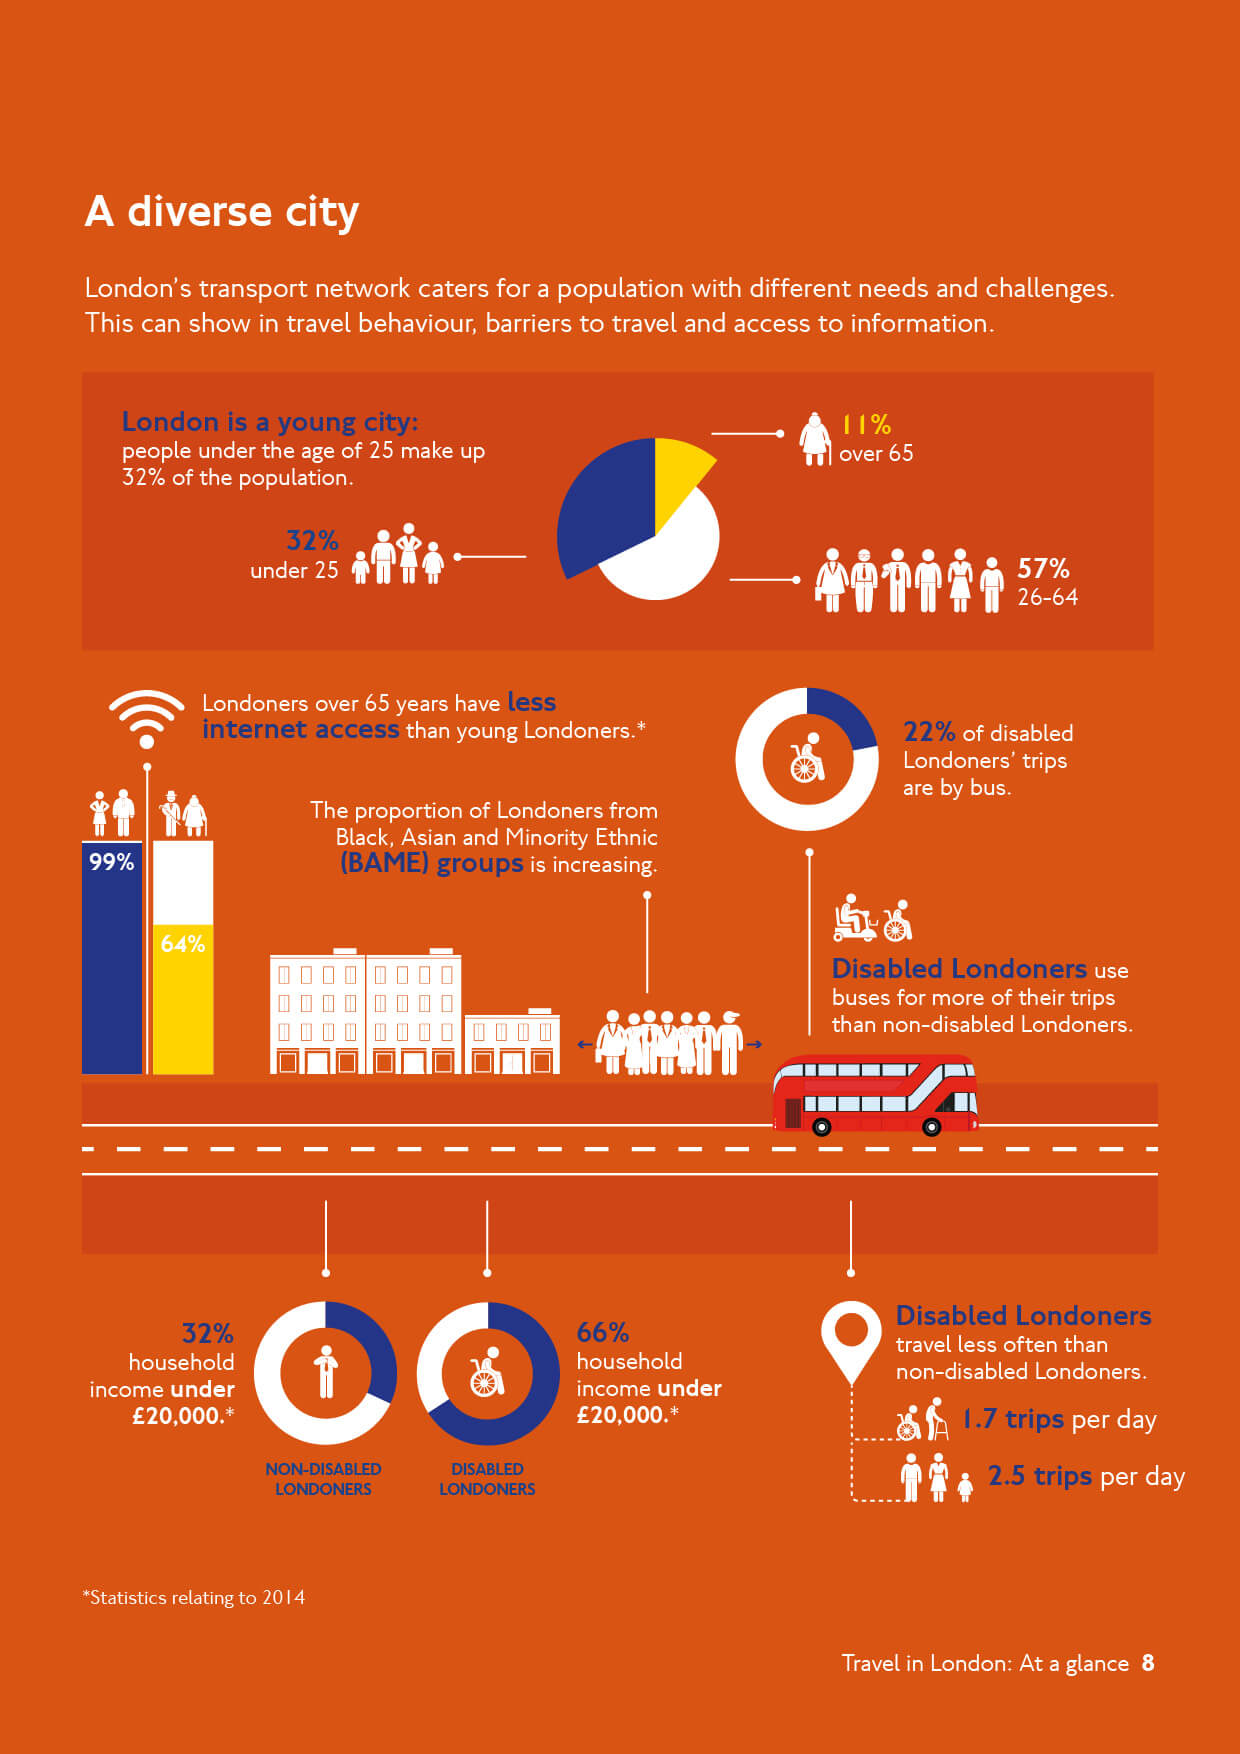
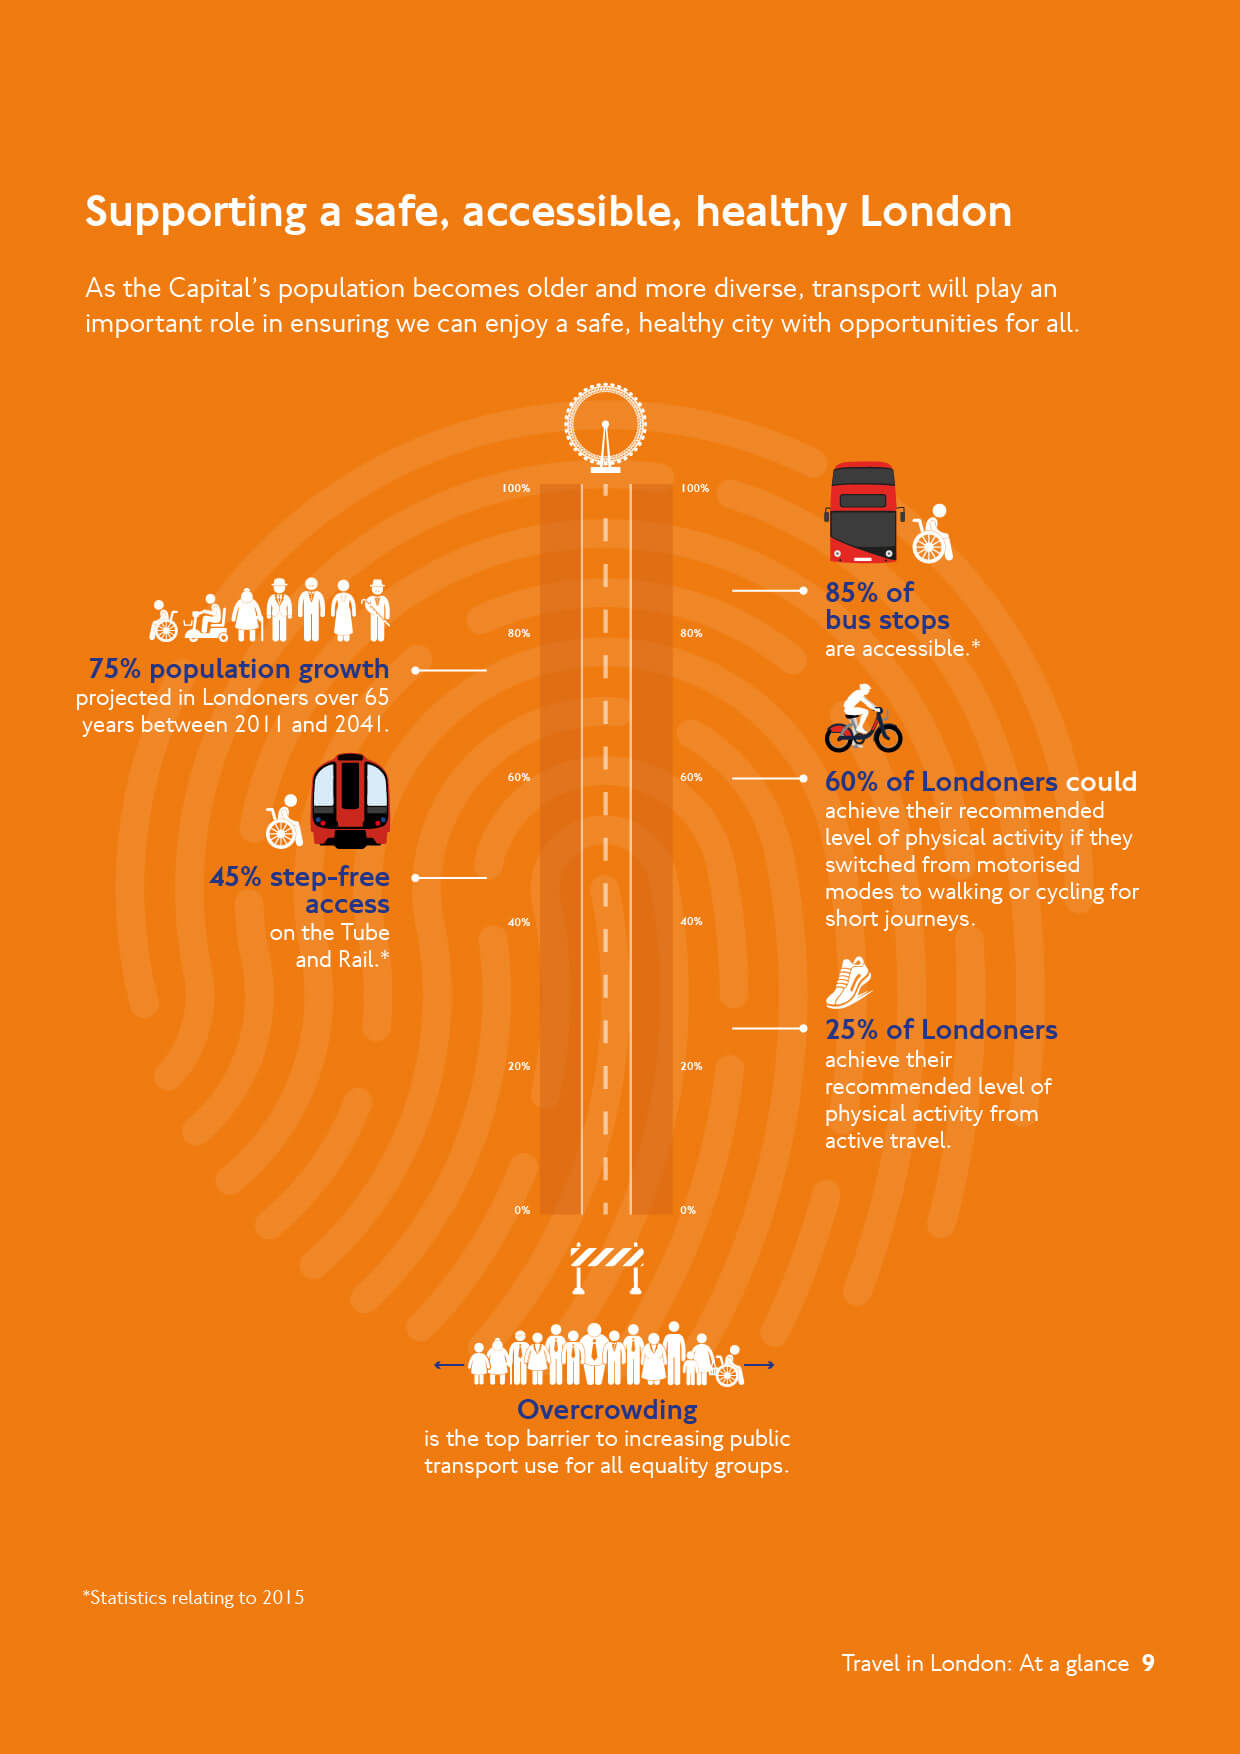
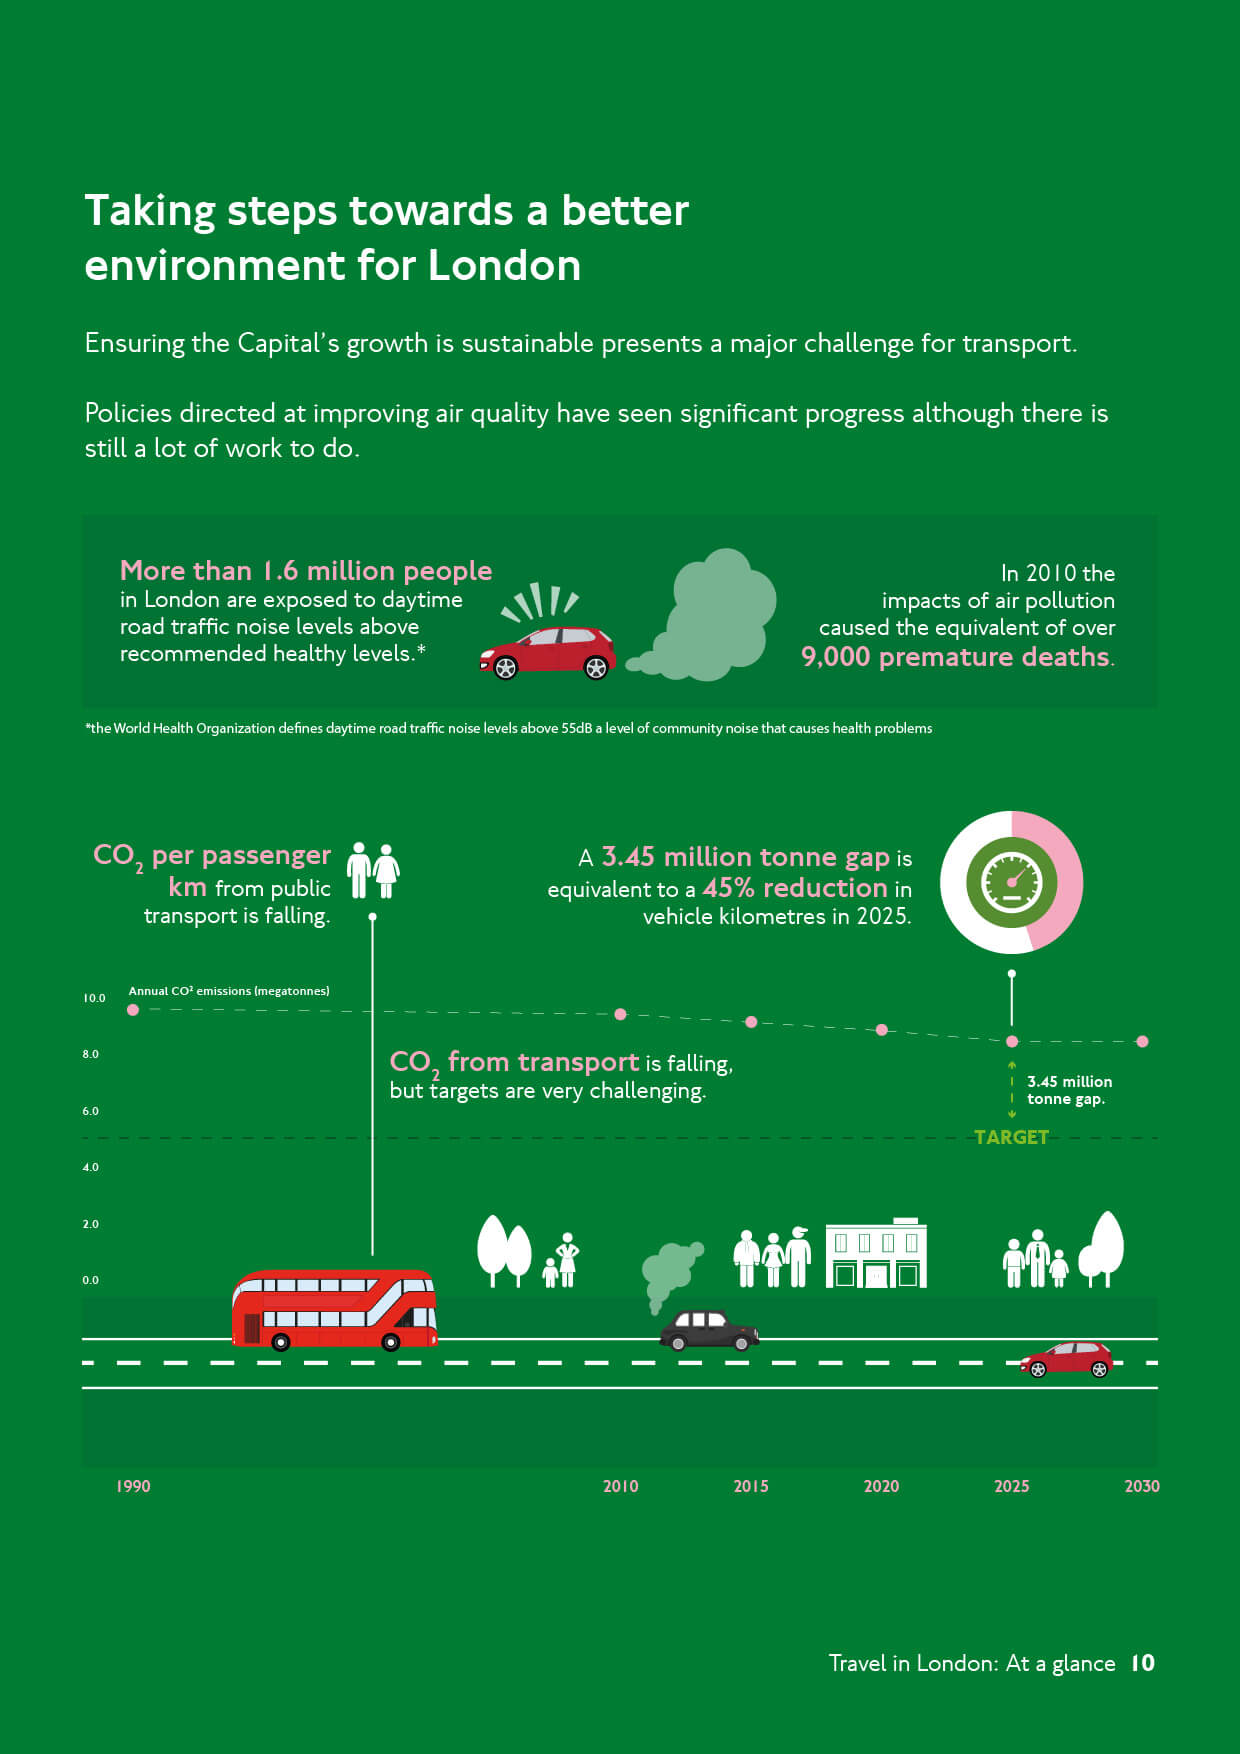
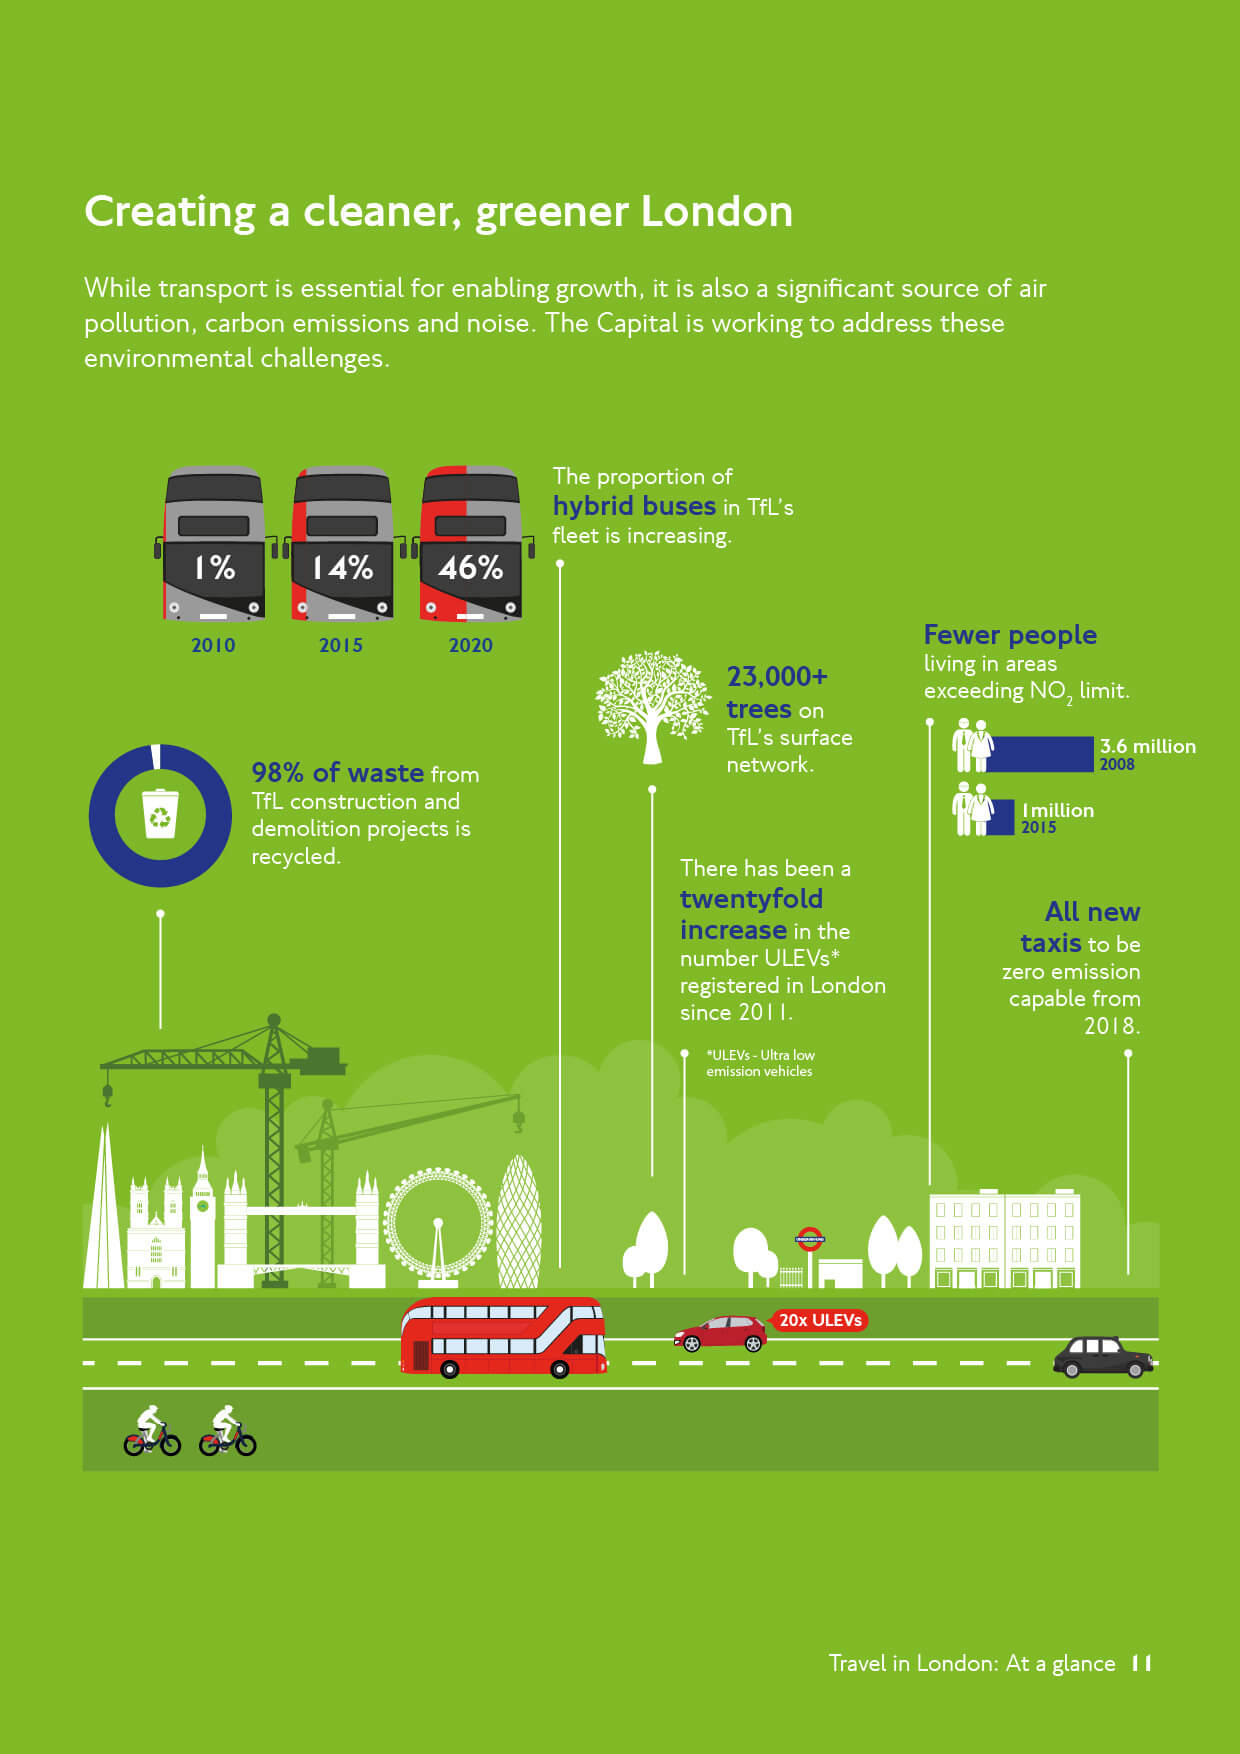
This report — number 9 in the series — was to have a different look from the other reports in the series. Focusing on a less text-heavy delivery, the 2016 report was conceived as an infographic report that would be bold, colourful and impactful — conveying the information in an interesting and easily digestible format.
Location
London, UK
Task
Data Visualisation

