Transport for London: Travel In London At A Glance
CASE STUDY
The opportunity to work with such an iconic brand was one to be savoured — and we came in to produce the annual Travel in London report for 2016 — which summarises trends and developments relating to travel and transport in London. You can view the final online version here.
The Creative Brief
This report — number 9 in the series — was to have a different look from the other reports in the series. Focusing on a less text-heavy delivery, the 2016 report was conceived as an infographic report that would be bold, colourful and impactful — conveying the information in an interesting and easily digestible format.
As well as an annual summary, this report would also detail progress towards implementing the transport and other related strategies of the Mayor of London. With this in mind, the tone and design of the graphics had to portray authority, insight, and a clear future strategy while being inline with existing brand materials.
Working closely with the marketing and publicity division, we set about creating a series of 10 infographics that would target a wide and varied audience. The primary goal was the delivery of information — the data and statistics had to be easily understood, and the individual graphics together had to present a single and cohesive message.
The Challenge We Faced
The biggest challenge with the messaging was the need for it to be understood by a wide audience, both internally within the company and also by the external public. With over 100 infographic designs under our belt, we were no stranger to this challenge. We began by creating an outline that was modern, visually compelling, and most importantly simple and easy to understand.
Being newer to the idea of infographics as a form of communication, TfL allowed us to take the lead on design and delivery. Data visualisation, at its core, is about interpretation and storytelling to assist people in understanding the significance of the data in a quick and interesting way. Infographics allow for patterns, trends and correlations to be represented that might otherwise go undetected in text-based data. It also allows for easier reading than large amounts of paragraph text.
Communicating important information and statistics in a compelling and digestible way using images can be a challenge as visuals are much more subjective than their text counterpart. It also has to be visually appealing — which is of course, also subjective. And this is where the fun part begins.
Our Process
The first step of any infographic is to understand the story and the messaging. TfL is a huge operation — they are the integrated transport authority for all of London. Their purpose is to keep London working and growing and to make life in the Capital better. In addition, the report needed to reflect trends and developments of the particular calendar year it represented (2016) relating to travel and transport in London.
Our interpretation of their information involved five critical areas in the report. We broke each into two graphics, with each graphic telling part of the story:
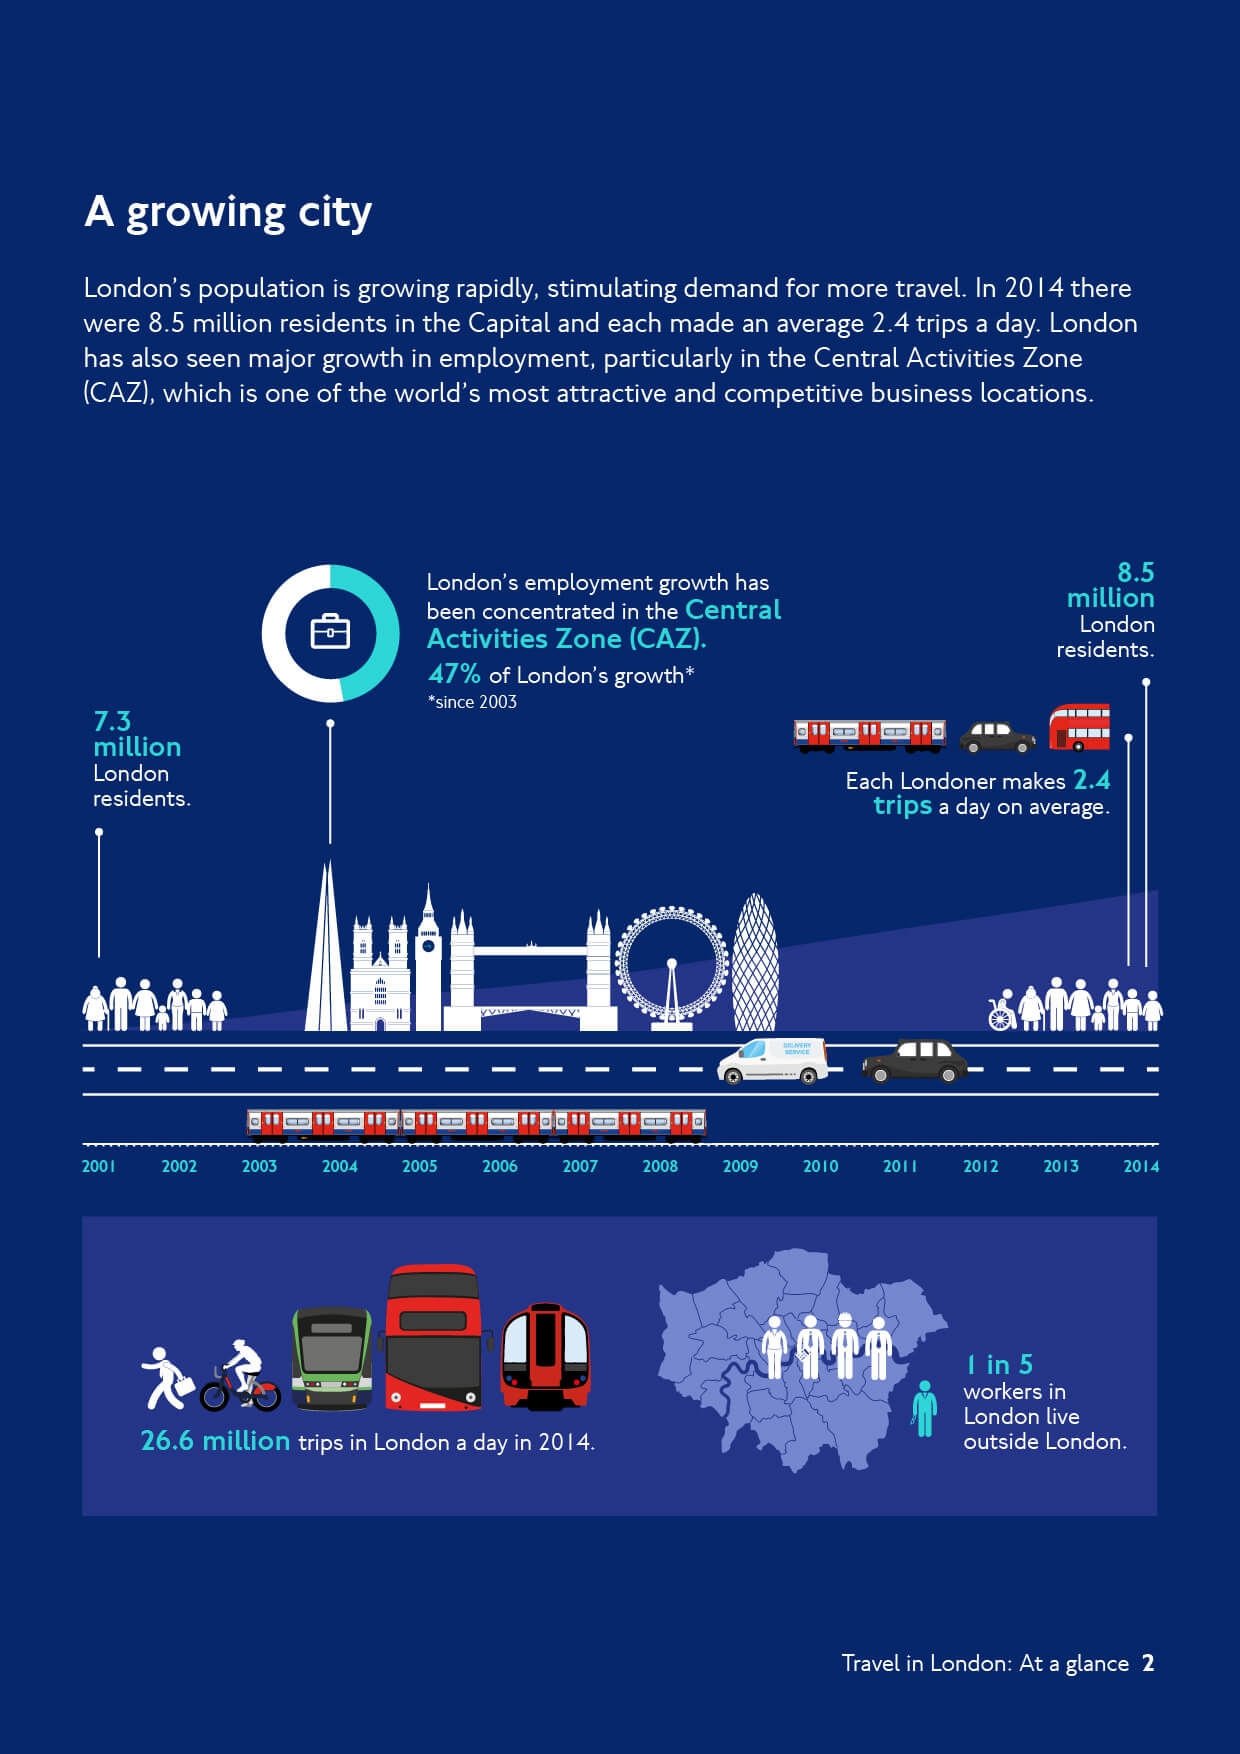
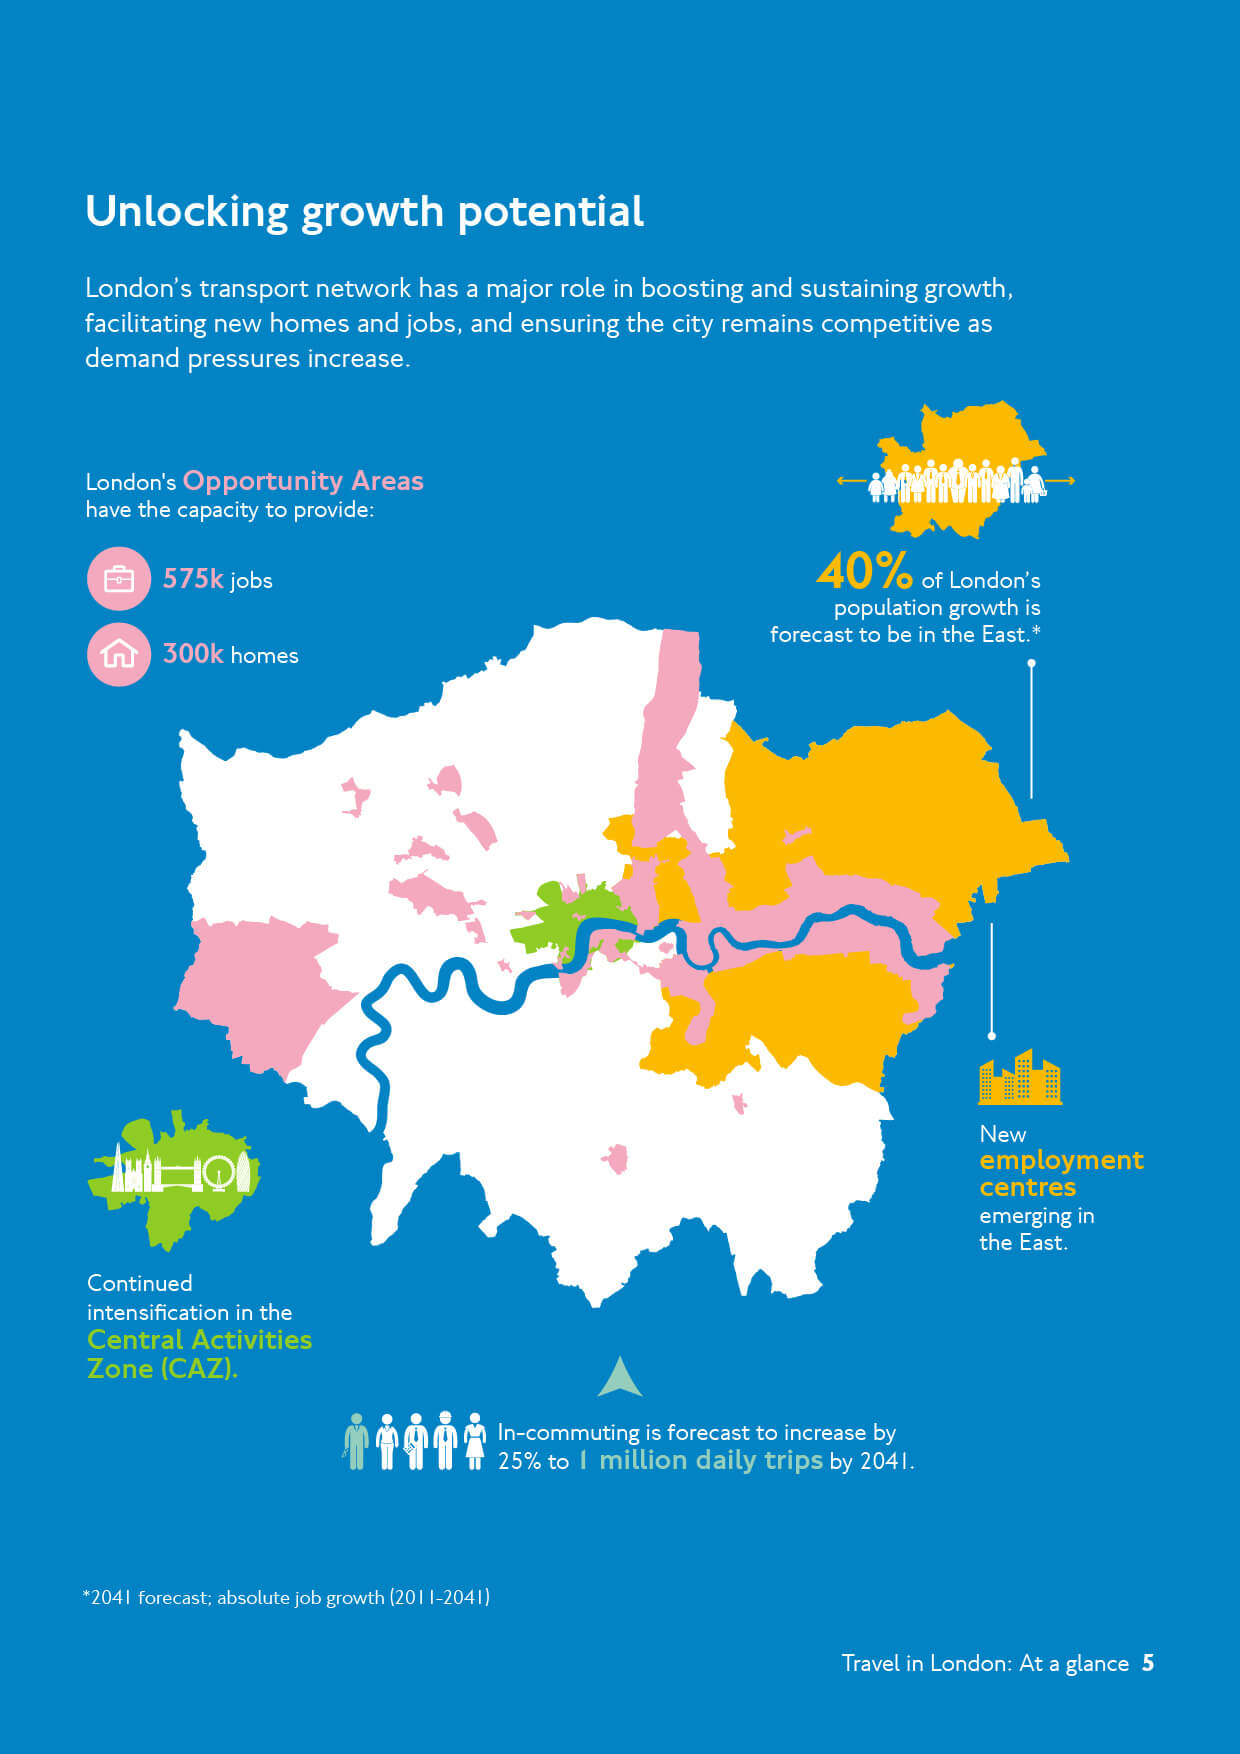
- Opener: Overview of the city
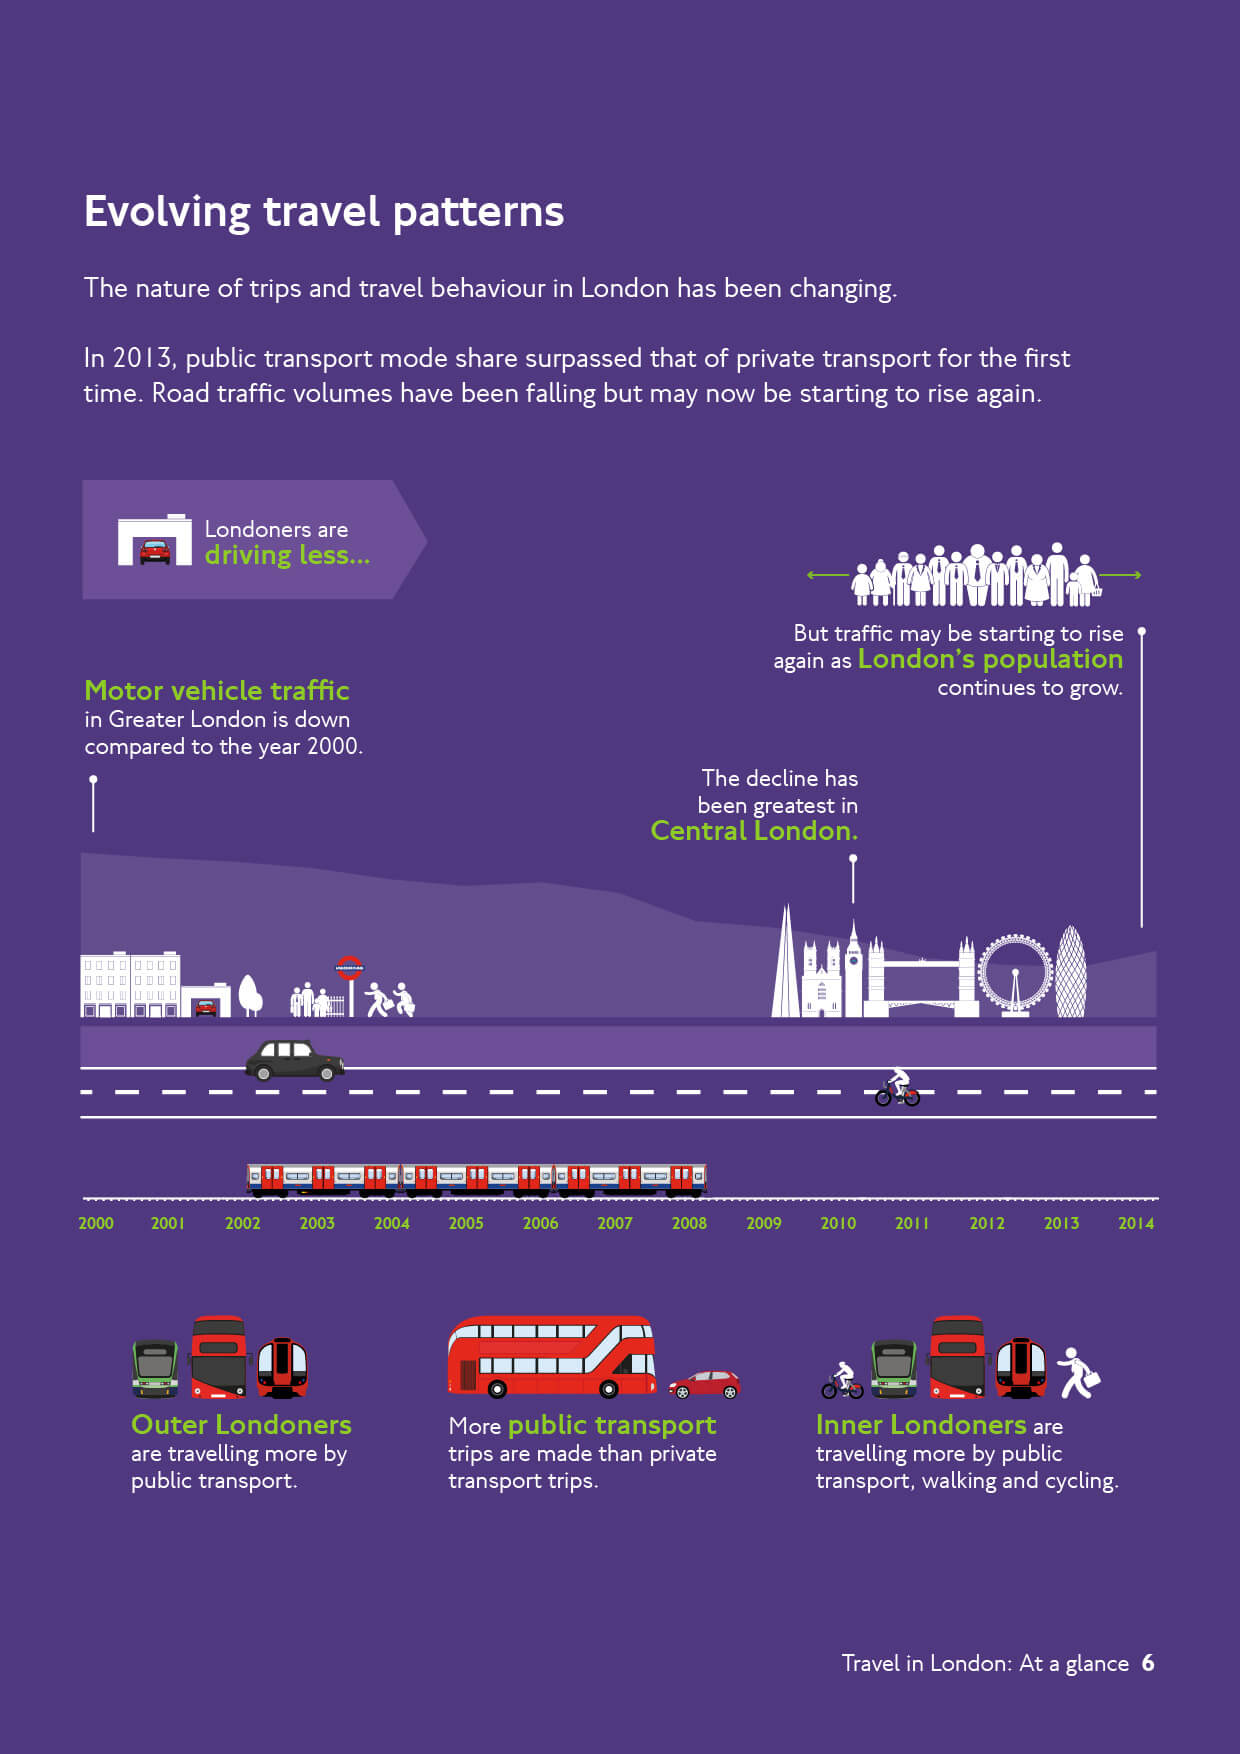
- Initial Stages: The evolution of their travel patterns
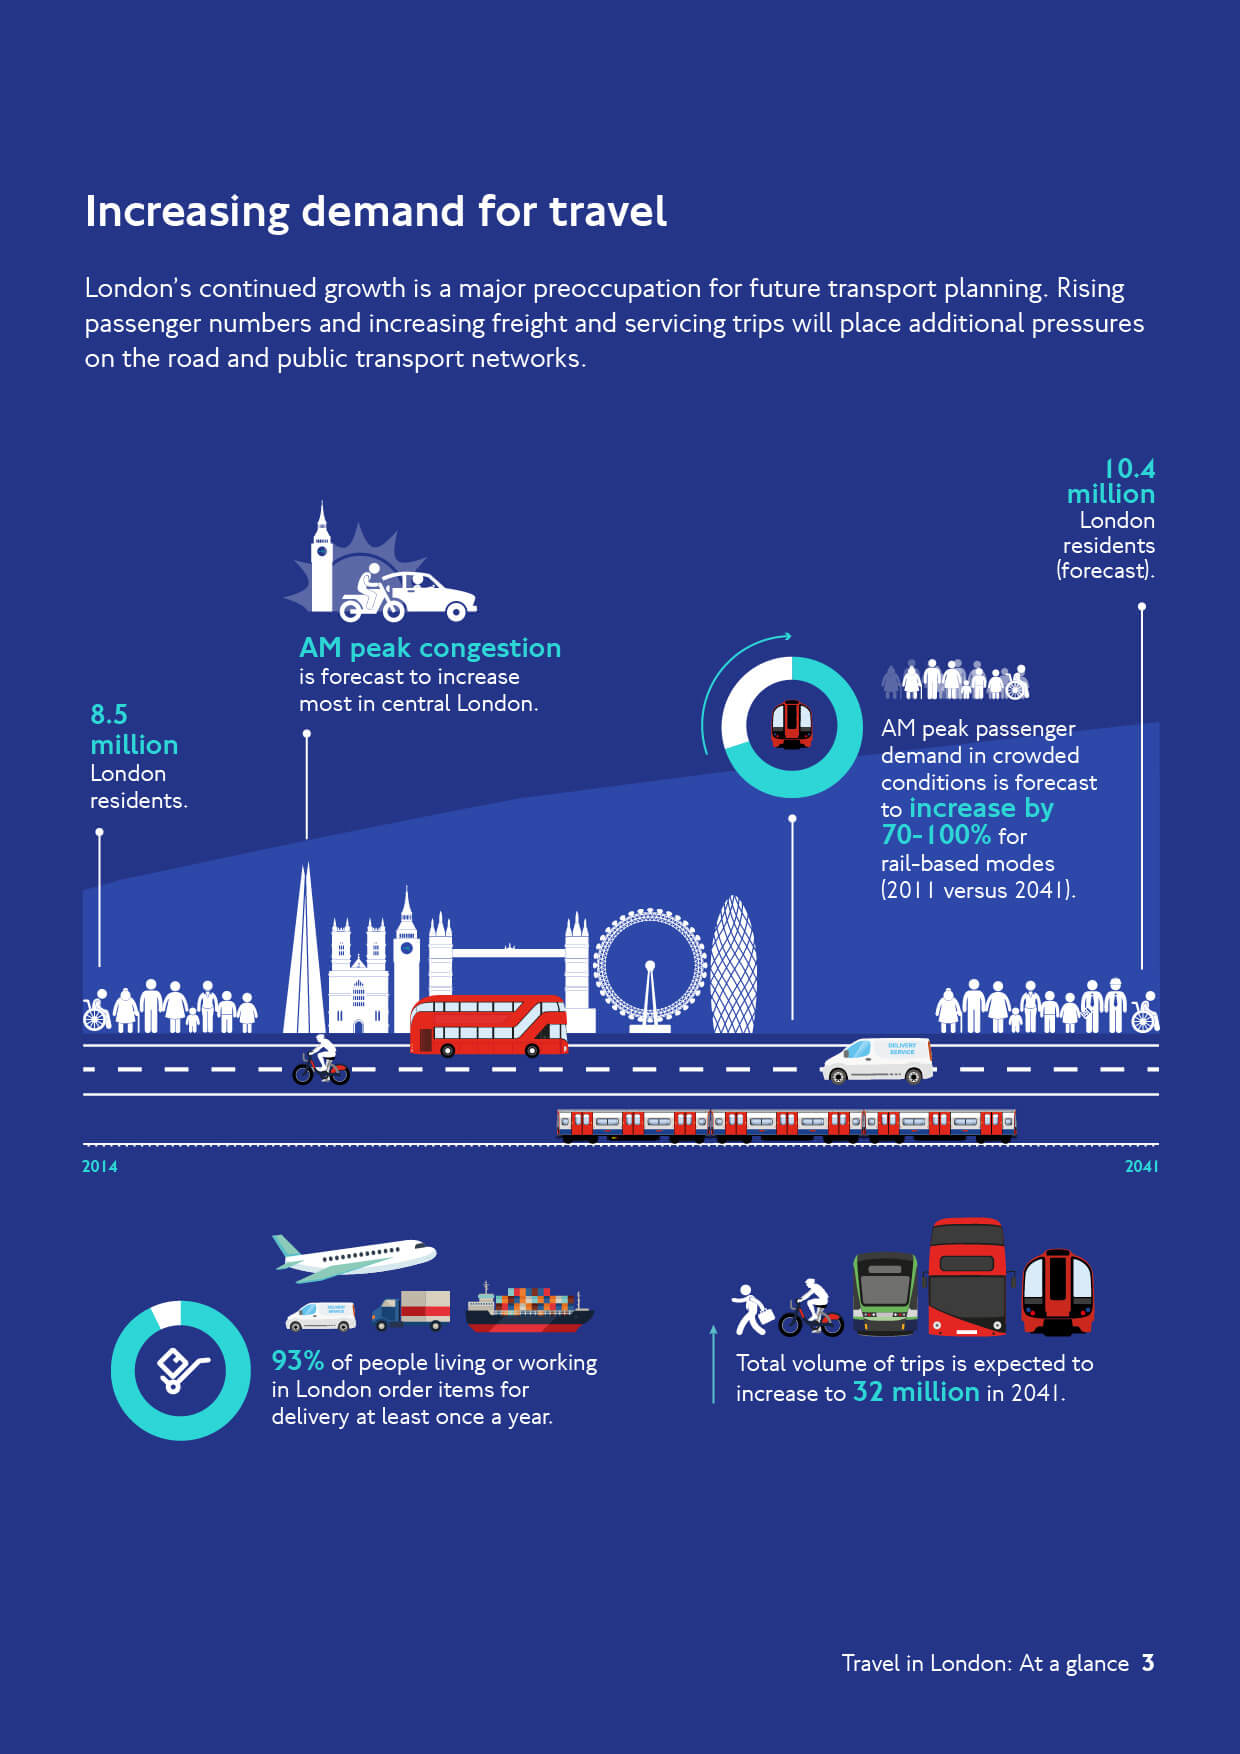
- Arch: The increase in demand for travel in London
- Solution: How the company has responded to lifestyle changes, diversity, travellers, access for people of various needs
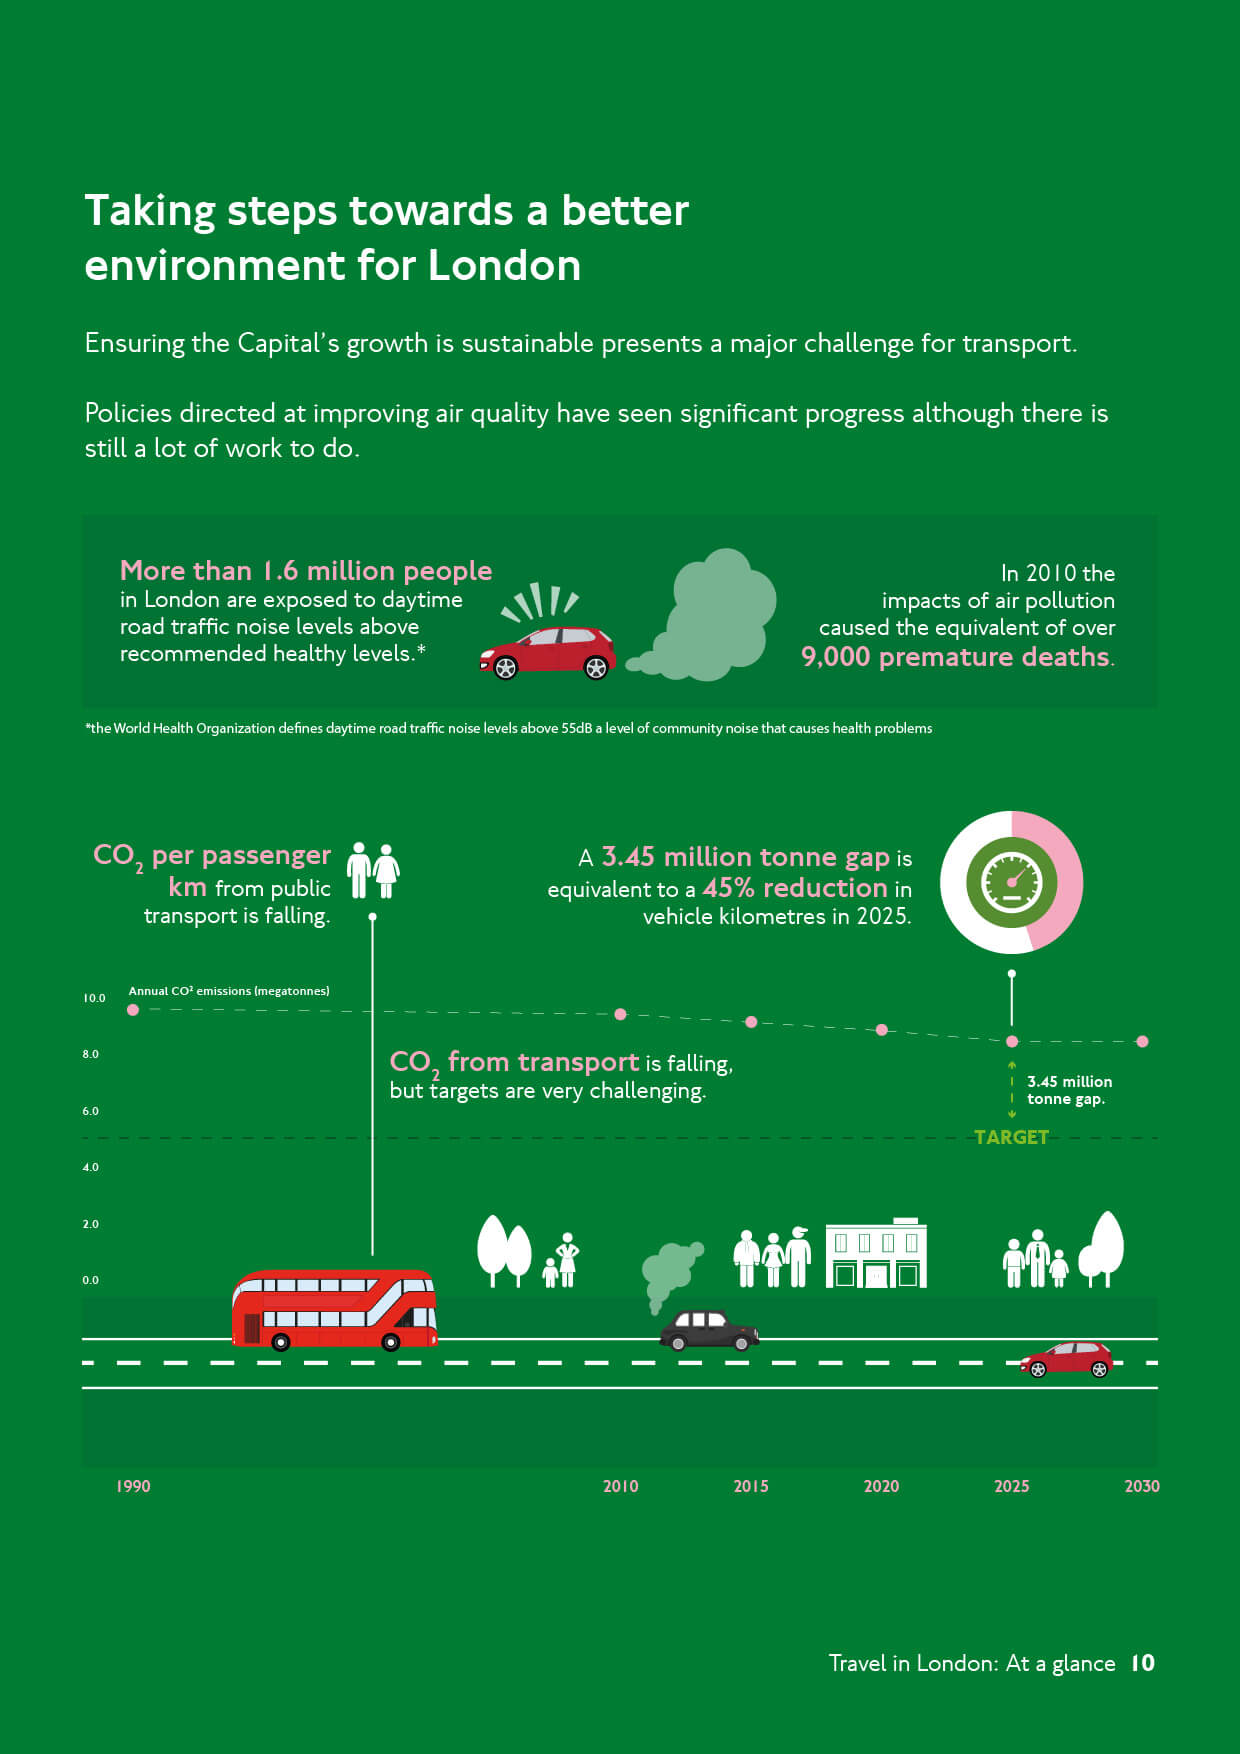
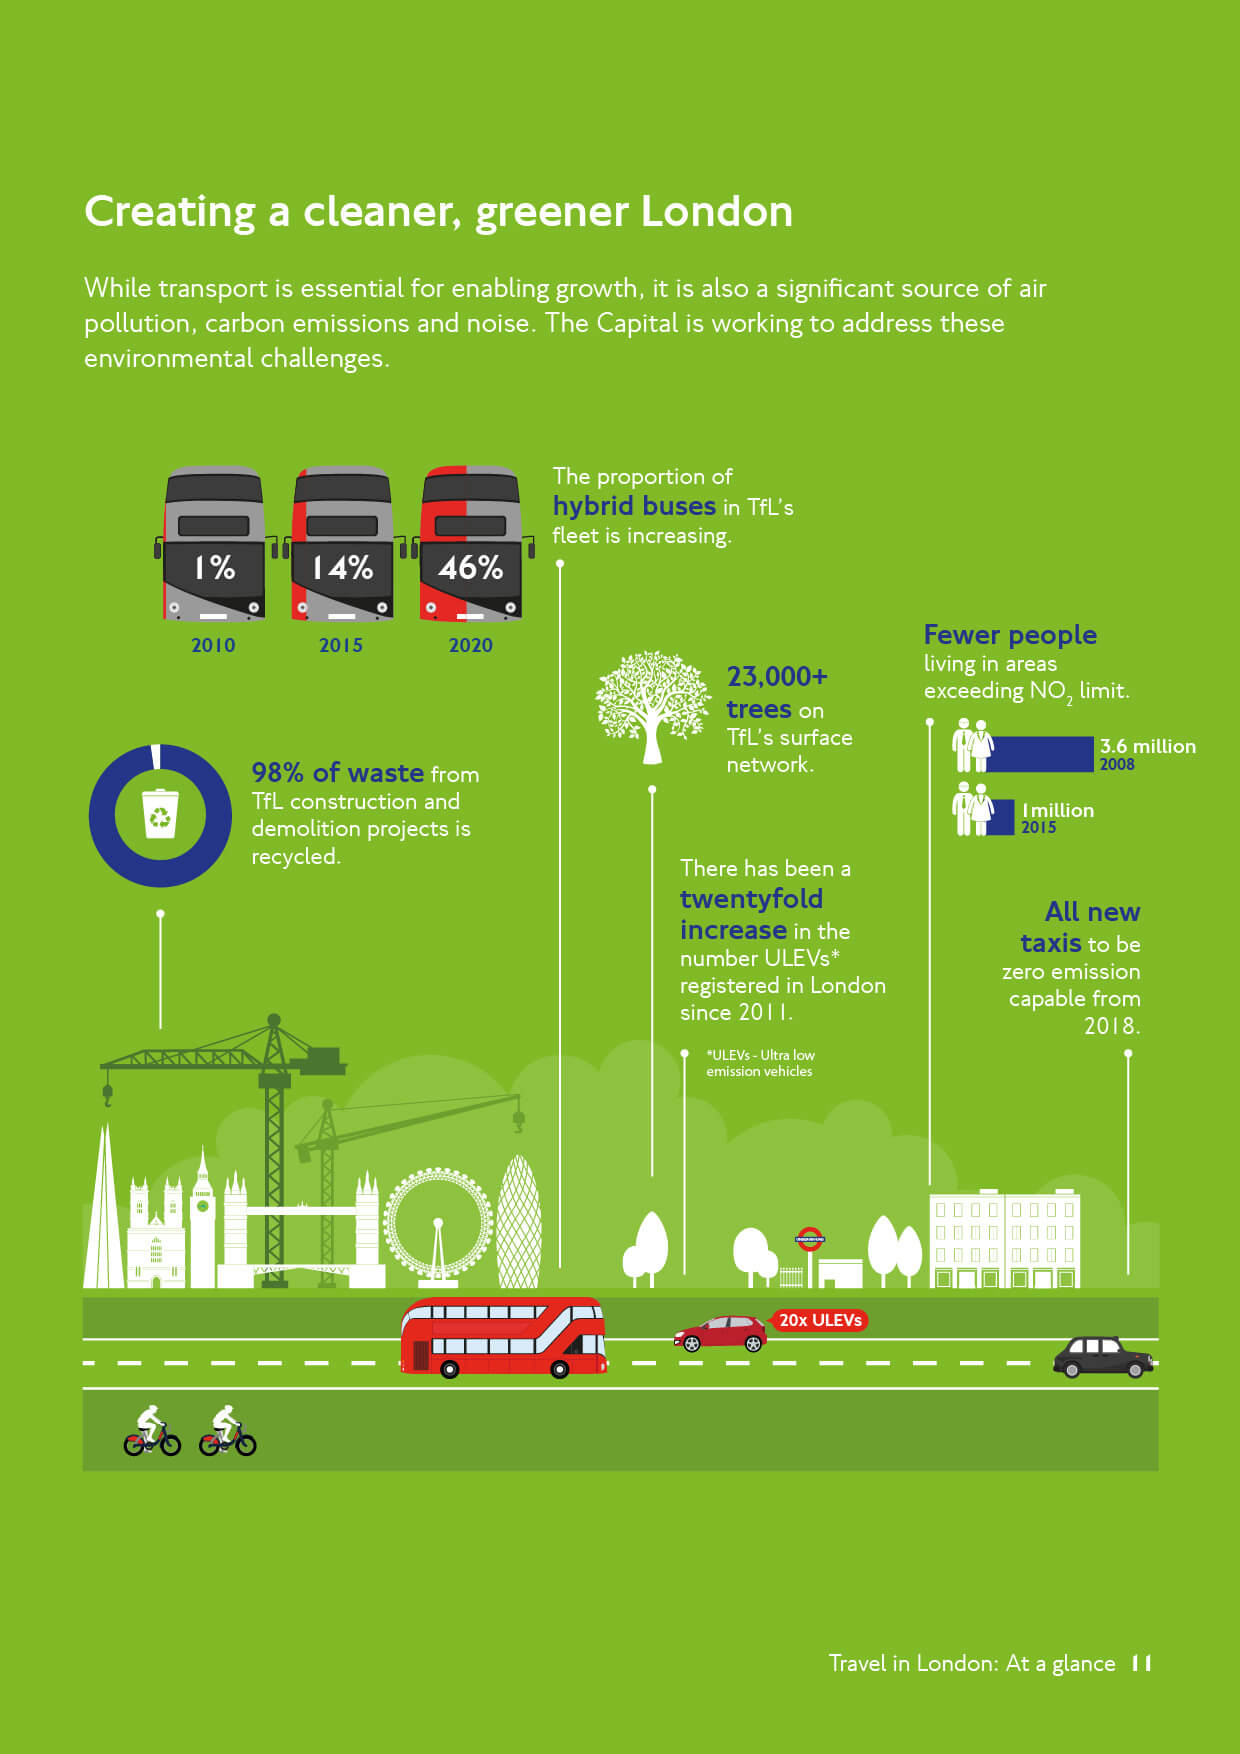
- Finale: How the company will expand over the next 15 years, increases in accessibility, safety, managing overcrowding, environmental initiatives
The Final Designs
The Results and Client Feedback
We had some stringent brand guidelines to work with, and we were visually representing iconic London modes of transport, like the double-decker red bus. With the new modern buses coming out that year, TfL didn’t have custom graphics on file which meant we were to create all the custom transport icons for this report and ensure that they were accurate and easy to identify compared to the real thing.
In order to also target a very wide and varied demographic with a large variation of race, age and gender, the icons also had to be simple and neutral.
With this wireframe in place, the next step was to flesh out the story in each graphic. This involved limiting the designs to a single page each, which achieving uniformity across the headers and layout structure to keep the overarching message clear. Outside of that, each infographic had its own individual life with colours and designs that simplified a complex set of data, as well as tell its own little story within the whole.
Loving the direction we took, TfL came back with very minimal changes and input to our overall concept and delivery. This enabled a much more rapid turnaround than anticipated and the graphics were completed and delivered over a week before scheduled completion.
With consistent onsite communication, a fast response time, and quick implementation of feedback, the project was smooth from start to finish.
The Final Word
Back Yourself With An Expert Full-Service Marketing Team
AGENCY HIRE
AGENCY HIRE
Great Choice!
CONSULTANT
CONSULTANT
Great Choice!
If You're Ready to Party, We'll Bring All The Snacks.
We’re available 24 hrs a day and we are more responsive than a Formula 1 car. Get in touch to start your project today!